CT Data Story: Housing Segregation in Greater New Haven
How patterns of racial residential segregation are shaped by discriminatory federal, state, and local policies
Today’s housing segregation is the result of decades of outright discriminatory federal, state, and local laws and policies—such as federal housing assistance programs that barred Black applicants—not simply the unintended consequences of economic and social factors. This was the argument presented by Richard Rothstein, a research associate at the Economic Policy Institute, at an event at Yale Law School organized by the Open Communities Alliance (OCA). Alongside several local panelists, Rothstein summarized findings from his book The Color of Law: A Forgotten History of How Our Government Segregated America. Rothstein outlined the history of policies allowing—even mandating—discrimination in federal and local housing loans, homeownership programs, and zoning. He argued that for us to combat segregation now, we must reckon with its origins and challenge the myth of “de facto” segregation.
A summary of this report is embedded below (click “Next” to advance slides), or may be viewed as a video on Facebook and Twitter (help us share!). Scroll down past this slideshow to continue reading.
Much has already been written on redlining—the denial of home loans in predominantly Black neighborhoods—and its lasting effects generations later. One of the clearest artifacts of redlining is the set of maps made by the Home Owners’ Loan Corporation (HOLC), a New Deal-era agency that helped finance loans for homebuyers. In these “Residential Security Maps” of cities across the country, including New Haven, the agency color-coded the extent to which lending was considered safe in different neighborhoods. An area labeled “best” was one in which investment was encouraged, while neighborhoods colored red and labeled “hazardous” were deemed too risky to invest in.
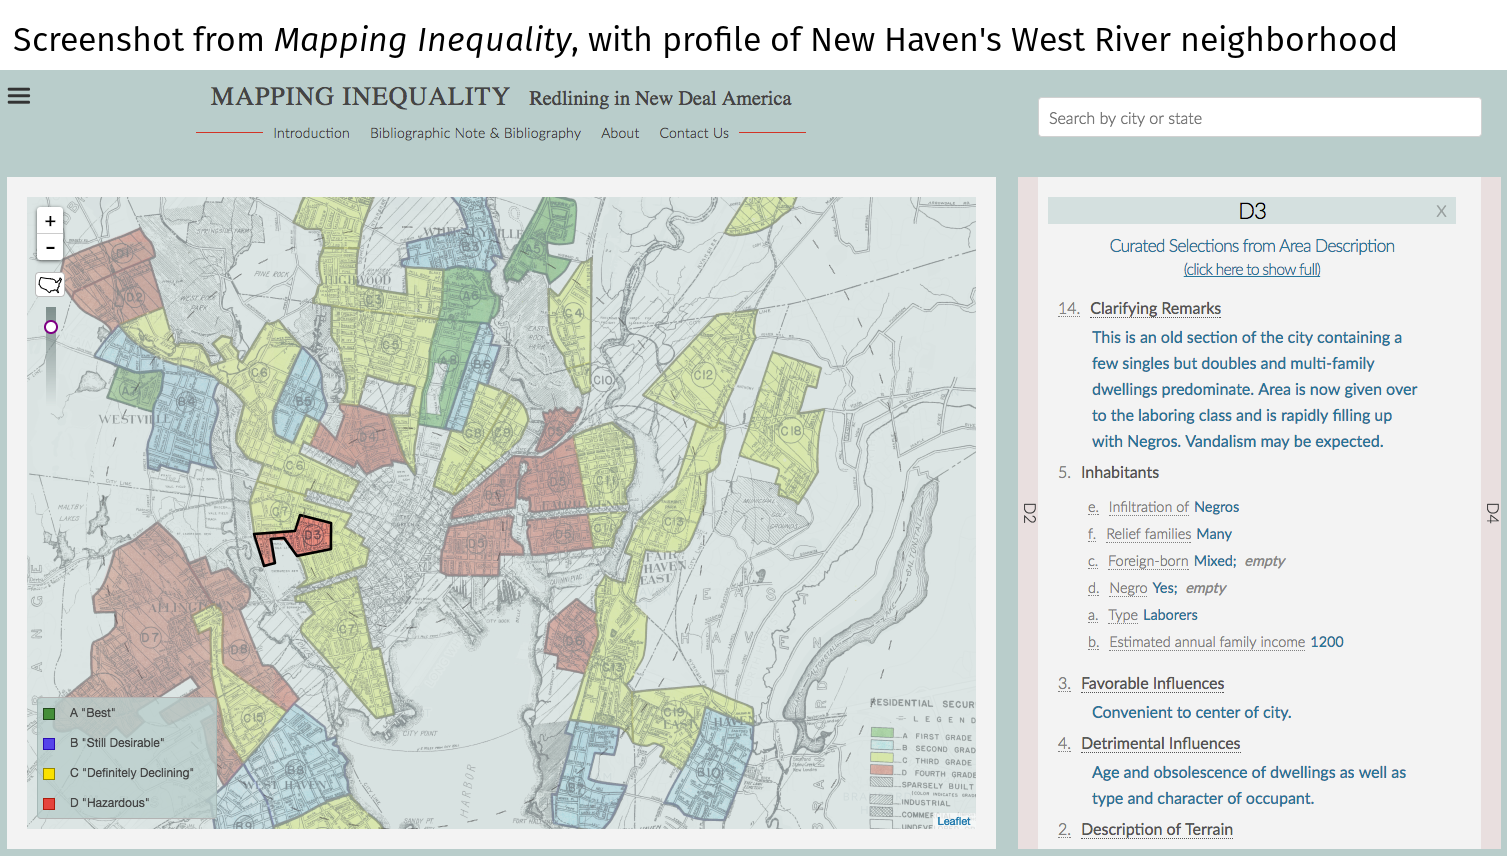
Despite this, when these maps were produced in the 1930s, banks’ decisions on where to give loans were based largely on who lived there, thereby creating a vicious cycle favoring the types of families who were already receiving loans. The maps were accompanied by profiles of details HOLC considered important in lending decisions, such as the primary type of workers—for example, domestic workers made up a bulk of New Haven’s “hazardous” areas, while executives and college professors occupied the “best” ones. Also included were notes of what share of the neighborhood was foreign-born or on relief programs, what ethnicities were “infiltrating” (an actual official term) the neighborhood, or simply a checkbox of whether or not there was a “Negro” population. These demographic details fed into decisions of whether a neighborhood was worthy of banks’ investments and, thereby, the security gained by homeownership.
The Mapping Inequality project, housed at the University of Richmond, launched last year to make these maps and the neighborhood profiles available online. At the Rothstein event, OCA presented their own maps of today’s housing segregation, placement of public housing, and opportunities for children in Connecticut, and referenced the in-depth work being done at Trinity College on segregation in the Hartford area. We at DataHaven were curious to take a look at the data behind some of these housing issues in and around New Haven.
The HOLC map of New Haven was made in 1937, and contains ratings of neighborhoods covering much of the city (minus Downtown), West Haven, the southern part of Hamden, and smaller parcels of East Haven and North Haven.
Only a few small areas have a grade A (“best”), but they have many characteristics in common. For instance, all grade A and most grade B neighborhoods were noted as home to executives, professors, and professionals. No grade A neighborhoods, and only one grade B, list any “infiltration”; this one exception is Beaver Hills’ Jewish population, a community that was growing at the time and remains significant today. No grade A neighborhoods, and only two grade B ones, had either foreign-born, “Negro,” or relief-recipient residents. Grade D neighborhoods were given descriptions such as being “given over largely to Negros employed as domestics” or having “no value.”
The availability of funding for home building and purchasing follows the same pattern—ample funds are listed as available in all grade A and many grade B neighborhoods, while none are available in grade D ones. These characteristics, plus the resultant distribution of funding, make it clear that this isn’t just an innocuous portrait of the housing market, but rather a document that details, and then reinforces, intentional segregation based on race, class, and immigration.
At first glance, an 80-year-old map of our city may seem outdated. Still, in much of New Haven and parts of West Haven, the majority of housing units were built before 1939, and are therefore the very same houses for which loans were being taken out or denied. Homeownership is a major way that families build financial security and wealth, and pass these on to future generations; today, we are just a few generations removed from the HOLC maps, and its resultant segregation is only getting more ingrained in our neighborhoods.
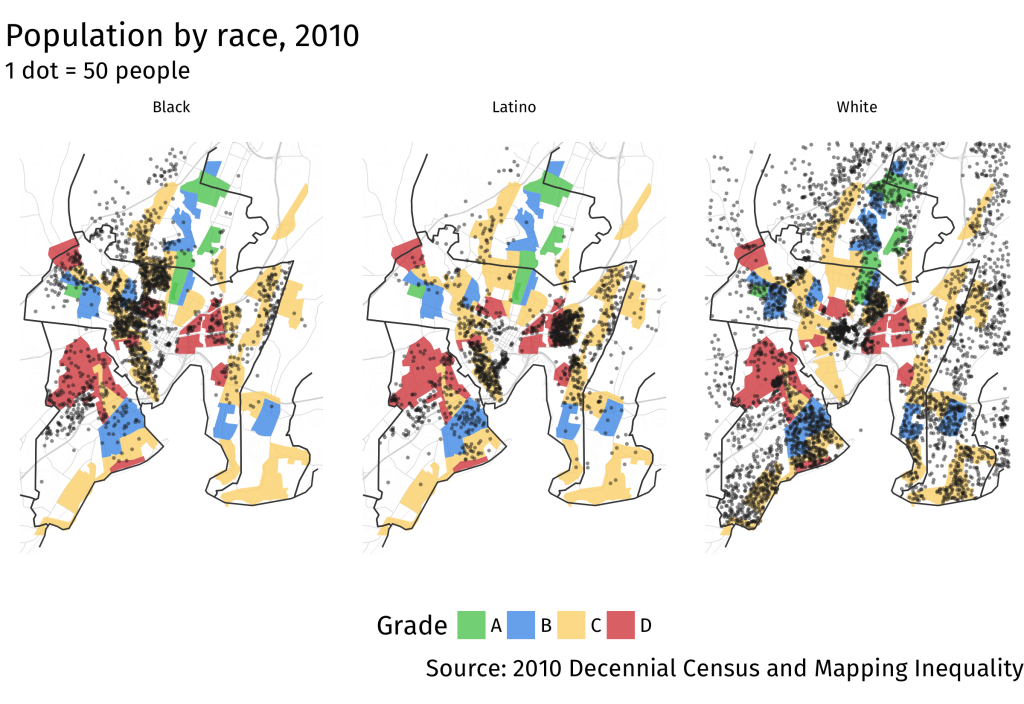
Indeed, today’s New Haven neighborhoods are fairly identifiable on the HOLC maps. And while density within the city has shifted, with areas like Downtown becoming more residential, racial boundaries by and large have not changed. Eighty years later, the stretch of land along Dixwell Avenue from Hamden into New Haven and then curving through Dwight and West River into the Hill is still home to largely Black communities, as are parts of southern Hamden and West Haven; Latino communities in Fair Haven and the Hill are clearly visible population clusters as well. By and large, Black and Latino residents are living in the same neighborhoods today that were marked for underinvestment and flagged for the presence of “Negroes” in the past, and few are in the prioritized areas. White residents today are spread out, bluntly put, on the blocks where Black and Latino residents are not.

This follows a pattern of striking segregation in Connecticut. A 2015 study from DataHaven found that Connecticut residents are more likely to live in racially concentrated areas of either wealth or poverty than in most larger metro areas nationwide. On a dissimilarity index—a measure that represents how much individual neighborhoods differ from their surroundings—the New Haven-Milford metro area’s segregation between Black and white communities is rated very high, and its segregation between Latino and white communities ranks in the most extreme tenth nationally.
At the Rothstein event, Professor Anika Singh Lemar, a Yale Law professor and co-panelist, flipped the question of why people of color are largely concentrated in small, dense pockets of our region, to instead ask why people choose to live in neighborhoods or towns that are nearly all white. To be specific, nearly three quarters of white residents of Greater New Haven live in a census tract—a geographical area often comparable to a neighborhood—that is at least 75 percent white. Only 7 percent of Black residents of the region live in a census tract that is 75 percent Black (the 4,800 residents of New Haven’s Newhallville neighborhood) and no tracts are so overwhelmingly Latino.
While the relationship between neighborhood segregation and homeownership is made up of complicated economic and social factors, there is data that can show us some of this landscape. As is typical of cities, New Haven has a much lower homeownership rate (28 percent) than its suburbs (73 percent). As is also the case elsewhere, Black and Latino families—whether in the city or the suburbs—are far less likely to own their homes.
Hamden and West Haven stand out in a few ways, beyond the fact that West Haven had large areas marked by HOLC for underinvestment. Both towns are in closer proximity to the city and much more racially and economically diverse than New Haven’s more affluent suburbs. And they both, the data shows, have housing that can support homeownership by Black, Latino, and lower-income families.

At risk of stating the obvious, families cannot buy houses that don’t exist. There is a very strong linear relationship between the existence of single-family housing and homeownership in a census tract, even when including condominiums and co-op units. Single-family houses are not distributed throughout the region: only about a quarter of housing units in New Haven are single-family houses. The old, large frame houses that once housed a single wealthy family, now subdivided into three units, are characteristic of much of New Haven’s housing stock, but are out of reach for a family looking to buy a house without the financial burdens of acting as landlord for two other households.
Housing stock varies by neighborhood within the city, and in many of the grade C and D neighborhoods, single-family housing is virtually nonexistent. The Hill has 5,433 units of housing for its 14,867 residents, but only 19 percent of these units are for single families. Similarly, only 20 percent of Dixwell’s housing units are single-family—just over 400 houses. Only 15 percent of the housing in Fair Haven, New Haven’s most populous neighborhood, is for single families; this amounts to 915 single-family homes for 17,131 residents. Both Dixwell and Fair Haven were given a grade D by HOLC, citing the “Negro” and immigrant populations that are still the backbones of their communities. The housing stock today, largely intact since the HOLC maps were made, still contributes to homeownership’s inaccessibility in these neighborhoods.
Meanwhile, many of the suburbs, aside from Hamden and West Haven, are made up almost entirely of single-family houses. Much of this has to do with zoning, which varies by town. Researchers at OCA and Trinity College are collecting town zoning laws to study the links between restrictive zoning and housing accessibility. All the towns in Greater New Haven aside from New Haven, West Haven, and Milford have zoning laws that either require a special permit to build multifamily housing or, in the cases of Bethany and Woodbridge, forbid it altogether. Some areas in New Haven, such as the affluent Westville and East Rock neighborhoods, are zoned for single-family housing as well, much as they were marked for investment during the HOLC days.

Our region is stuck with a housing catch-22: for the most part, the areas with more single-family houses, such as the suburbs or neighborhoods like Westville or East Shore, have higher housing values. A lower- to middle-income family might find that the houses that exist are in places they can’t afford, and the places they can afford don’t have houses to buy.
Even “affordable” housing is unaffordable for many New Haveners. The federal Department of Housing and Urban Development (HUD) sets thresholds for housing affordability based on the median income of a region. Because New Haven families generally have lower incomes than those of the region, about half of New Haven’s families, and a third of those in West Haven, fall into HUD’s “very low-income” category. HUD then calculates how many housing units they would consider affordable for a family of four at that income. As of 2015, only 1,774 units of housing in New Haven—12 percent of the city’s owner-occupied housing—meet this affordability criteria. The next higher income bracket, making about $70,000 per year, fares better, with 7,629 affordable units in New Haven, and close to 15,000 combined in the inner ring suburbs. But houses don’t go up for sale very often. Add to this the fact that 40 percent of New Haven’s homeowners already spend more on housing than HUD considers affordable for them, and affordable homeownership still seems out of reach for the average New Haven family.
One nefarious solution emerged in the 1990s and early 2000s to “solve” this problem: subprime and high-cost loans. Neighborhoods that had been denied loans through redlining now saw a chance at homeownership, and were targeted by predatory lenders. Researchers and consumer protections advocates warned of the racial disparities in this type of lending and its potential for a crash, but these warnings fell on deaf ears in the lead up to the housing crisis.
Within New Haven, the geography of high-cost mortgages at their peak in 2006, right before the crash, looks much like that of redlined neighborhoods in the 1930s. High-cost loans made up 41 percent of the city’s home purchase loans that year; nearly half of these loans in 2006 were to residents of Fair Haven, the Hill, and Newhallville. Since then, the federal government has cracked down on such lending practices, but many lower-income neighborhoods have yet to recover from the housing crash and ensuing foreclosure crisis and recession.

Rothstein offered a cautiously optimistic view that since policy got us to this place, policy can get us out. Fellow panelist State Senator Gary Holder-Winfield pushed the audience to think of housing segregation in a broader context that includes distribution of resources and overpolicing, and urged us to pressure legislators like himself on policy decisions with disparate impact on communities of color.
Today, redlining looks less like overt grades on a map and more like the blackbox algorithms that data scientist Cathy O’Neil calls “weapons of math destruction,” whereby people’s zip codes and all types of personal data are used to automate the granting or withholding of loans. Following Rothstein’s logic, there’s a role for the data community in understanding and combating the use of big data for upholding these generations of bias. The Obama administration’s Affirmatively Furthering Fair Housing rule required cities to use maps and demographics data to identify racial segregation in housing and barriers to fair housing access. Under the Trump administration, revocation of this rule was proposed and HUD Secretary Ben Carson has been critical of the rule’s “government-engineered attempts to legislate racial equality.” Any such efforts to know who lives where depend on an accurate census, but recent funding shortfalls and policy changes at the US Census Bureau put us at risk of undercounting the types of communities most in need of fair housing and federal and state programs.
We need better data on segregation and access to housing, and a better understanding of the zoning practices that keep lower-income families and families of color locked into certain neighborhoods. Redlining isn’t a practice of the past, and there is plenty more we can do to move away from the color-coded discrimination maps of 80 years ago.
Click on the links below for more data stories. Note: Some of our more complex charts may be easier to read on a horizontally-rotated smartphone screen, tablet, or large screen.