$15,000 for Darien families, $700 for Hartford: Mapping the Unequal Effects of H.R.1 Tax Relief in Connecticut
By Andrew Carr, Mark Abraham, and Nat Markey, DataHaven
Introduction
The recently passed One Big Beautiful Bill Act (H.R. 1) will have unequal effects on American families and will contribute to income and wealth inequality. A recent report from the nonpartisan Congressional Budget Office (CBO) shows that H.R. 1 will increase after-tax earnings for households at the top of the income distribution, while negatively impacting households in the bottom fifth of the distribution.
The CBO estimates weighed the positive effects of reduced taxes against the costs of reductions in Medicaid and SNAP in order to estimate average effects on each decile of the household income distribution.
For this report, DataHaven combined the CBO estimates with U.S. Census data to estimate the impact of H.R. 1 tax relief on the bottom quartile (less than or equal to the 25th percentile), middle 50 percent (between the 25th and 75th percentiles), and the top quartile (above the 75th percentile) of each Connecticut town’s household income distribution. The Methodology section below has detailed information on how we produced these estimates.
Results
Overall, we estimate that the bottom 25 percent of Connecticut households will collectively lose $148 million (an effect of negative $417 on average) due to H.R. 1. Meanwhile, households in the middle of the distribution will collectively receive $1.3 billion in tax relief ($1,815 on average), and households in the top 25 percent will receive $3.4 billion in tax relief ($9,535 on average).
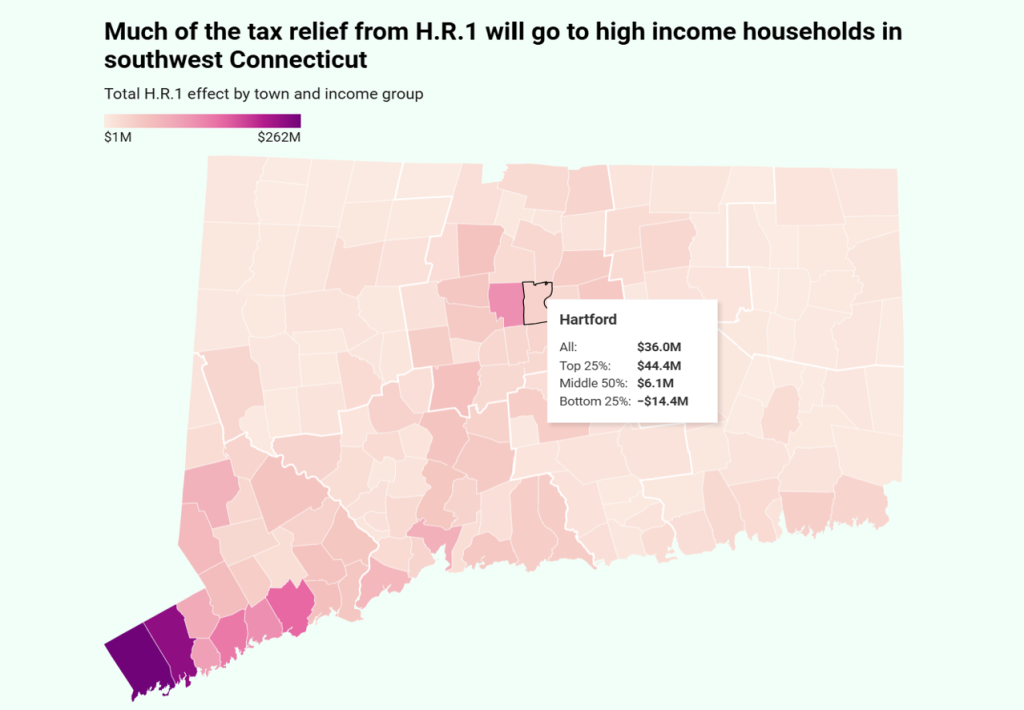
Our estimates of the aggregate effects on households in each town, and the distributions of those households by income group within each town, are shown in the map above. Click on the map to explore data for each town. Estimates of the effects on individual households living in each town, county equivalent (COG area), and income group within each may be found in the Additional Interactive Maps and Data section below.
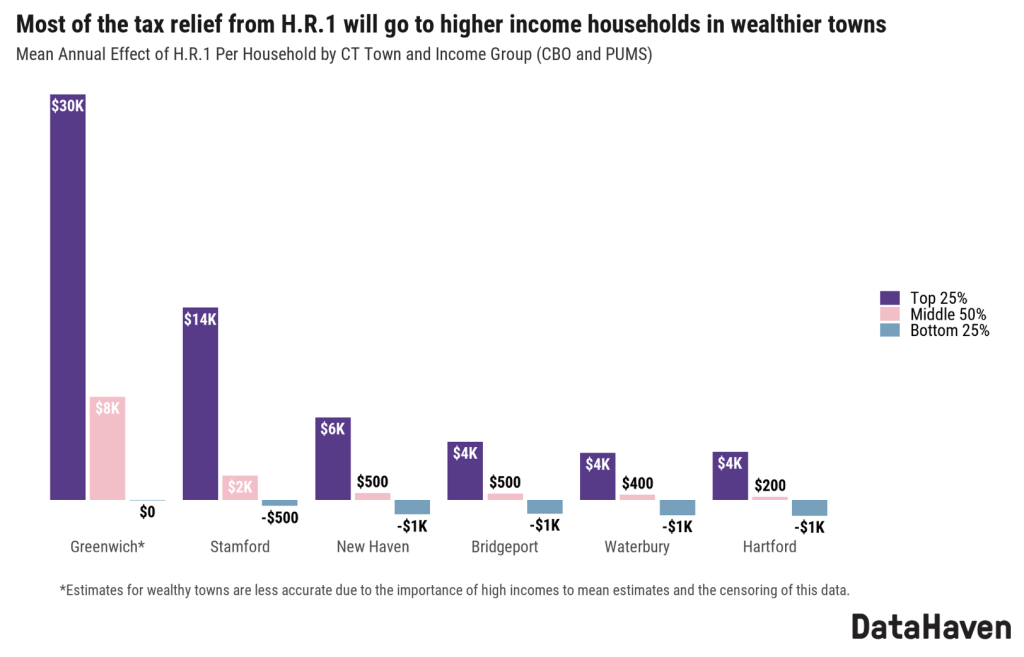
The figure above shows the effects of H.R. 1 by income group within select Connecticut towns. Most of the tax relief from H.R. 1 will accrue to the 25 percent of households with the highest incomes in each town. For example, high-income households in Greenwich will benefit from an additional $30K in tax relief per year on average, $22K more than the $8K that households in the middle of Greenwich’s income distribution will receive each year. The bottom 25 percent of Greenwich households will receive an average of $0 in tax relief.
In New Haven, Bridgeport, Waterbury, and Hartford, middle-income households will experience negligible benefit from H.R. 1, while low-income households will be negatively affected. For example, in New Haven, the top 25 percent of households by income will each receive $6,200 in tax relief on average, households in the middle will each receive $500 in tax relief on average. The bottom 25 percent of New Haven households by income will each see a $1,100 loss on average.
Our estimates showing unequal tax relief by community do not convey the full extent of hardship that H.R. 1 will impose on low-income households, as much of the negative effect of the bill will be experienced through loss of benefits like healthcare and food assistance. Additionally, the estimates in the CBO report do not consider how other current policies such as tariffs (projected to cause price increases equivalent to a $1,900 to $7,600 loss in average disposable income per household), or how the indirect impacts of the H.R. 1 legislation on society (such as through increased debt service, macroeconomic effects, and potentially catastrophic, community-wide losses of healthcare coverage), will ultimately impact families at different income levels and across different neighborhoods in Connecticut.
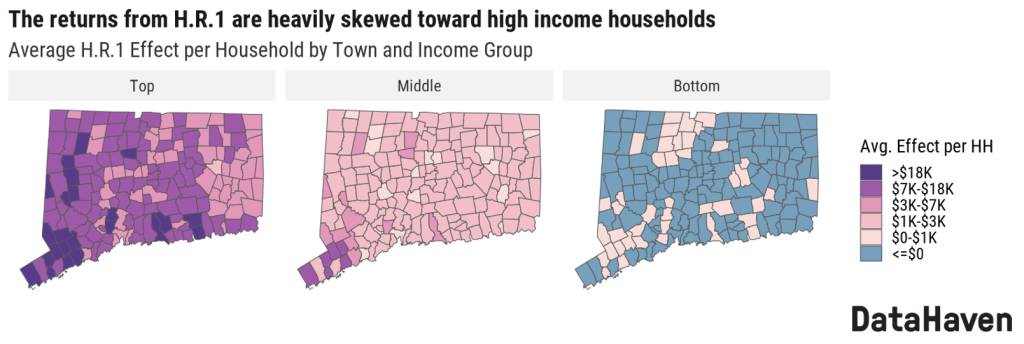
The above panel of maps shows how H.R. 1’s effects are distributed across income groups and towns. Each of these maps shows the average annual effect for the top 25 percent, middle 50 percent, and bottom 25 percent of households by household income.
The right map indicates that low-income households in most towns will be negatively affected by H.R. 1. The middle map shows that although H.R. 1 will affect middle-income households on average across all towns, these benefits will be less than $3K per year in most towns. Middle-income households in 70 percent of towns will receive less than $2K per year in tax relief, and in 16 towns they will receive less than $1K per year. The left map shows that the benefit of H.R. 1 will be heavily skewed toward the top 25 percent of each town’s income distribution. In 23 towns, high-income households will save more than $18K per year on average. In four towns – Greenwich, Darien, New Canaan, and Westport – high-income households will see tax relief of more than $30K per year on average. The top quartile of household incomes in these towns is comprised of households whose incomes are in the top two percent of the national household income distribution.
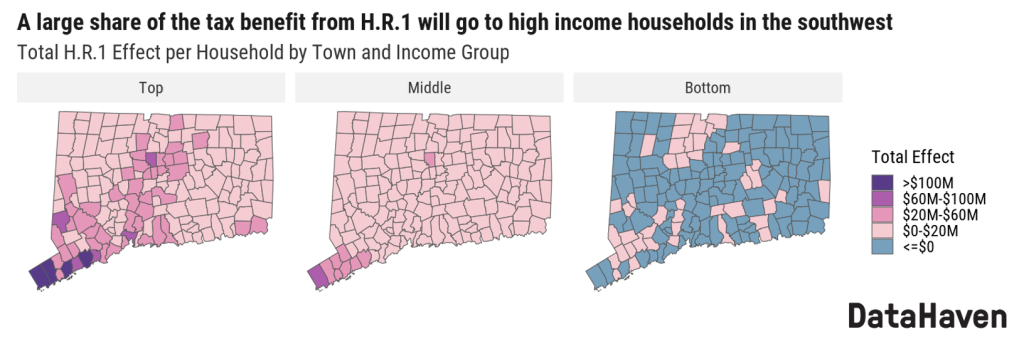
This next panel of maps shows the total effect of H.R. 1 by town. These maps take into account the household populations of each town. The left map shows that a disproportionate share of the additional money flowing to Connecticut households due to H.R. 1 will go to high-income households in the southwest part of the state, especially in Stamford ($195 million for high-income households), Greenwich ($173 million), Norwalk ($116 million), and Fairfield ($116 million). The right map shows that for most towns, the lowest-income 25 percent of households living in that town will experience a negative effect from the legislation.
Overall, the towns seeing the largest tax relief in the aggregate will be Greenwich ($262 million), Stamford ($239 million), Fairfield ($158 million), Norwalk ($143 million), Westport ($121 million), and West Hartford ($121 million), even though the bottom 25 percent of households across those 6 towns will collectively lose $12 million. Households in the state’s largest city, Bridgeport, will receive only $60 million in total, with $61 million in tax relief flowing to high-income households in that city, while the bottom 25 percent of households living in Bridgeport lose over $14 million.
Additional Interactive Maps and Data
Click here for a downloadable Excel spreadsheet with estimates for Connecticut towns, COG areas, and the state, and by income group within each area.
Discussion
The findings in this report indicate that H.R. 1 will considerably exacerbate the problem of rising income inequality in Connecticut, which has been increasing in the state since 1970. And even if H.R. 1 is eventually repealed, the impact on wealth inequality is likely to be permanent.
One way that wealth inequality appears at a community level is through unequal access to public infrastructure, such as quality parks and libraries. Wealthier towns and neighborhoods often have more money and political influence to dedicate towards maintaining high-quality public spaces. For example, in Greenwich, 93 percent of adults say their parks are in good condition and the town spent $182 per person on libraries in 2021, while in nearby Bridgeport, only 56 percent of adults report good-quality parks, and library spending was just $58 per person.
Resource gaps are closely tied to differences in health and longevity as well. According to the 2023 Fairfield County Community Wellbeing Index, adults under the age of 75 living in Bridgeport lost years of life at a rate more than three times higher than those in Greenwich, reflecting sharp differences in community investment. The disparity widened by H.R. 1’s impacts on tax policy could be further compounded as H.R. 1 also causes tens of thousands of area residents to lose access to healthcare and food assistance.
Increasing wealth inequality can also contribute to the state’s housing affordability and homelessness crisis, and reduce social mobility.
We encourage policymakers to use this report and data to understand and remedy the disparate impacts that H.R. 1 will have on their constituents.
Methodology
Estimating the effects of H.R. 1 on Connecticut towns consisted of two steps: estimating national income percentiles for each Connecticut household and mapping these percentiles to a distribution of H.R.1 effects.
Estimating income percentiles for Connecticut households
Connecticut households were ranked according to where they fall on the national household income distribution. ACS PUMS data for 2019-2023 was used to create a table of household-size adjusted household incomes by percentile for the United States.
Next, the ACS summary table B19001 was used to estimate household incomes for each Connecticut town. This data provides counts of households by income bin (less than $10K, $10K-$20K, ect.). The binsmooth R package was used to estimate samples of exact incomes from these counts.
These incomes were adjusted for household size. First, shares of household sizes (1, 2, and 3 or more) were calculated for each PUMA. Then, each town’s incomes were divided into groups by household size based on the household size distribution of the PUMA in which the town is located. The incomes were adjusted by household size by dividing by the square root of the household size.
Finally, each household’s percentile was calculated from its size-adjusted income based on the percentiles of the national income distribution.
Mapping from income percentile to H.R.1 effect
The CBO report provides ten estimates, the average H.R. 1 effect for each decile of the household income distribution. These CBO estimates are based on results from a microsimulation study from the Joint Committee on Taxation.
These estimates were used to plot coordinates of the cumulative share function of the H.R. 1 effect. This function is also known as the Lorenz curve.
These points were then interpolated to get the H.R. 1 effect cumulative share as a function of the household income percentile. The reason for using the cumulative share function is that CBO’s estimates can be converted into points on this function. For example, CBO estimates an average effect of -$1,214 for the bottom decile. This can be divided by the sum of the average effects of each decile to get -.056, the share of the bottom bin. The cumulative sum of the effects can be divided by the sum of all ten effects to plot points along the cumulative share function.
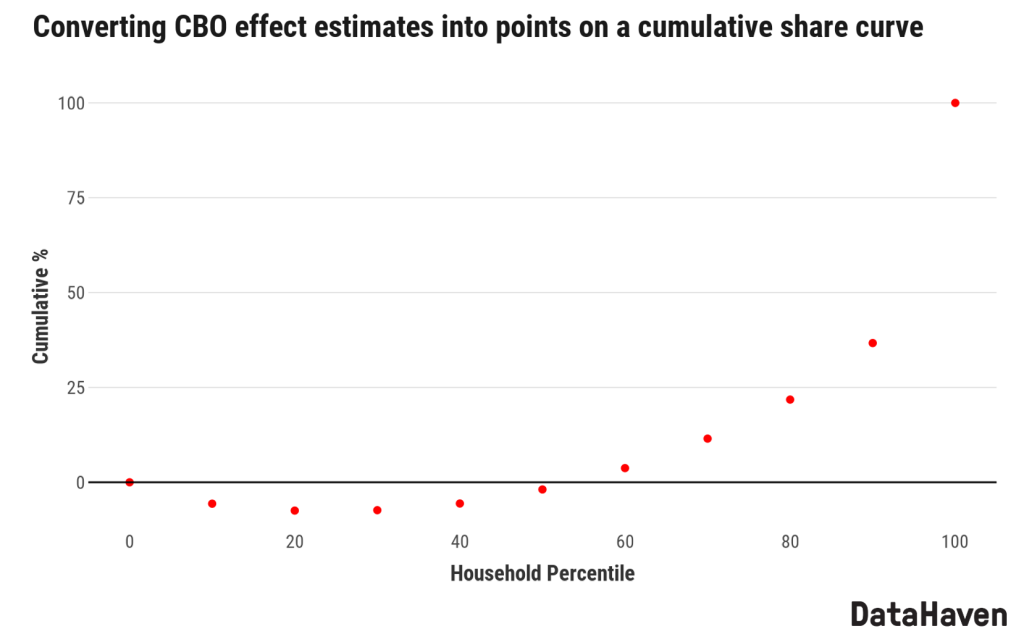
This plot shows the degree to which H.R. 1 disproportionately benefits the top decile, which is estimated by CBO to receive about 63 percent of the H.R. 1 benefit. This indicates that the distribution of H.R. 1 benefits, like the distribution of income, is right skewed. This poses a challenge for interpolation. The interpolated function must have two properties: first, the effect should increase from left to right along the range of percentiles. We can ensure this by fitting convex quadratic functions to each pair of points. Second, the slope of the function for the top bin should increase at an increasing rate to capture the right skew of the distribution. This is approximated by manually adding points, represented by the blue points below. The points are interpolated with a set of convex quadratic polynomial functions using the schumaker R package. The image below shows the interpolated function.
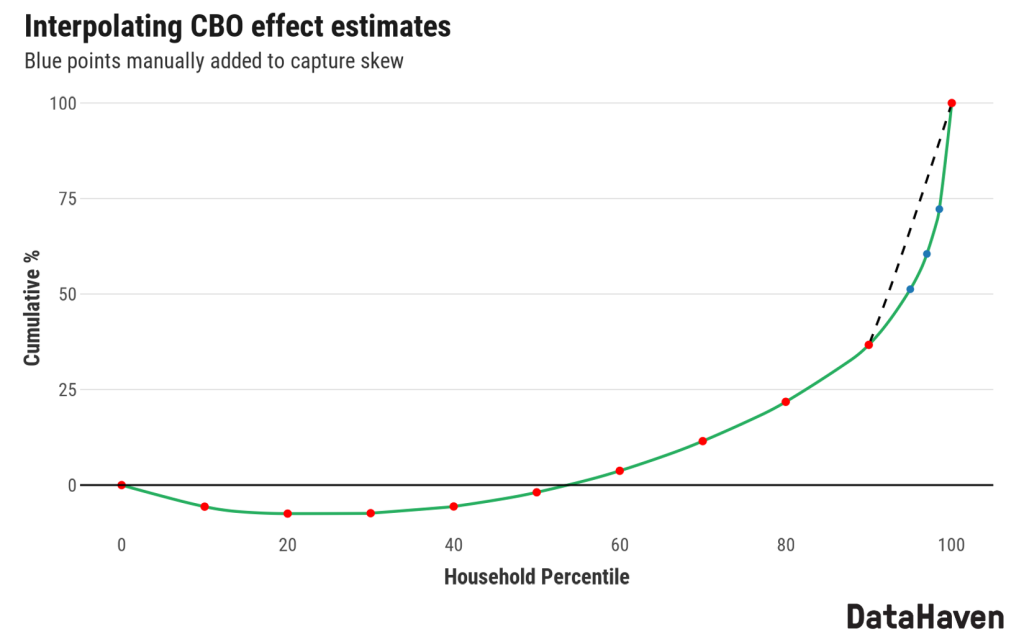
The black dashed line shows how the Schumaker method interpolates the top bin by default. This creates a discontinuity in the slope increase of the interpolated function. The blue points result in a function whose slope increases more smoothly. These additional points have no bearing on the total or average effect within the top decile. Rather, these points influence the distribution of effects within the decile (reducing the incomes closer to the 90th percentile and increasing the incomes closer to the 99th percentile).
H.R. 1 effects can be calculated from this function by multiplying the derivative at any point along the curve by the average effect, which can be calculated from the CBO estimates. The plot below shows the distribution of effects by percentile.
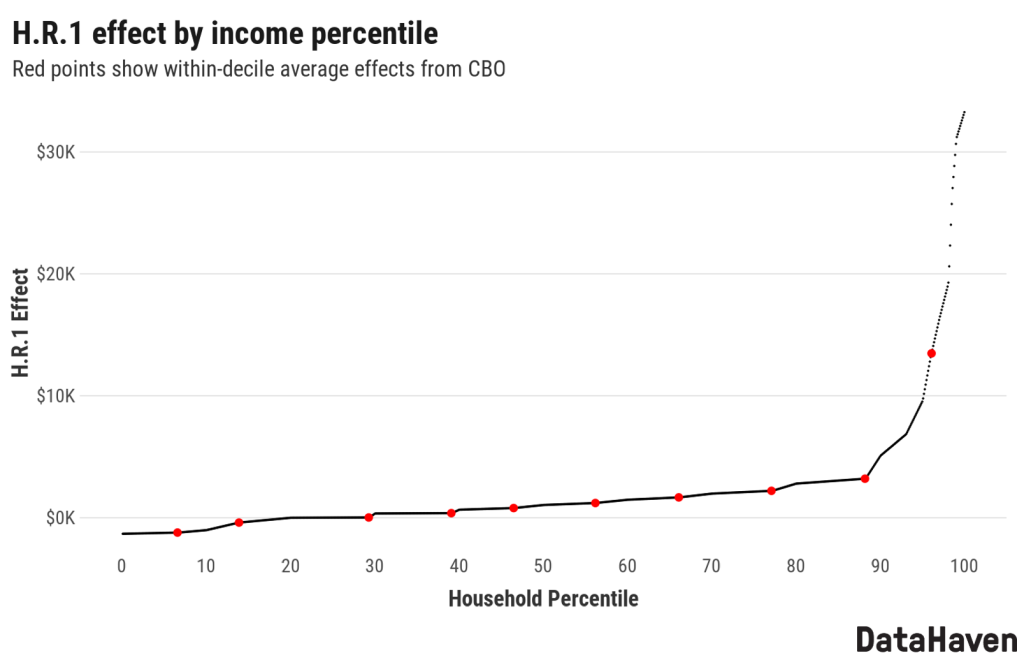
Finally, an H.R. 1 effect is assigned to each household based on its percentile.
The income groups for each town are based the town’s 25th and 75th household income percentiles. The percentile levels that determine the income groups vary considerably by town. For reference, in Connecticut as a whole, the bottom 25% of households by income earn less than $46,000, the middle 50% earn between $46,000 and $167,000, and the top 25% earn $167,000 or more.