

So far this month, DataHaven has published four new reports covering some of the most urgent issues facing Connecticut: housing, homelessness, disability rights, and behavioral health. Plus, scroll down to learn about how you can join DataHaven staff at our Data Office Hours events from March 4 to April 1 in Hartford, Middletown, New Haven, New London, Norwalk, and virtually.
Four new reports from DataHaven
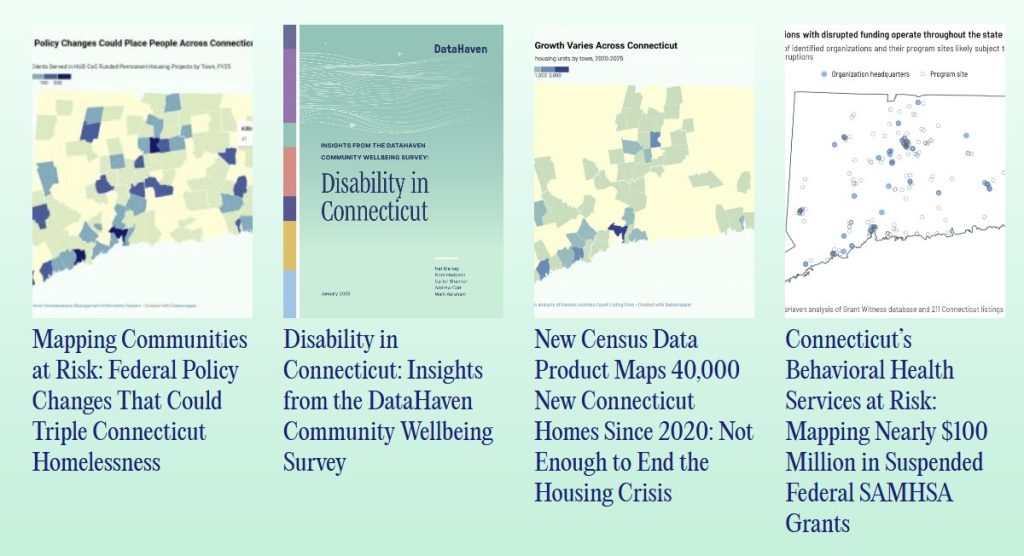
Mapping Communities at Risk: Federal Policy Changes That Could Triple CT Homelessness
Homelessness in Connecticut has risen every year since 2021 — and a recent federal policy shift threatened to make it dramatically worse. This new report, co-published with United Way of Connecticut, the CT Coalition to End Homelessness, and Advancing Connecticut Together, highlights that more than 6,000 residents in permanent supportive housing have been at risk of losing their homes under proposed federal policy changes. Whether you’re a policymaker, advocate, service provider, or concerned neighbor, this report maps the risk at the state legislative district and town level, provides background on the root causes of homelessness, and outlines the policy solutions that can prevent a crisis.
Disability in Connecticut: Insights from the DataHaven Community Wellbeing Survey
This new report, produced with guidance from advocates across the state, draws on DataHaven’s Community Wellbeing Survey to examine how disability affects people’s lives in Connecticut. If you work in healthcare, social services, housing, or community advocacy, this report provides essential local data that was previously not available from any other source on a population whose needs are frequently undercounted.
New Census Data Product Maps 40,000 New Connecticut Homes Since 2020
Connecticut ranks last in the nation in active housing listings per household and has a need for up to 400,000 new homes. This DataHaven report uses newly-released Census Address Count data — potentially a more accurate tool than traditional building permit surveys — to map exactly where housing supply has grown (and not grown) across all 169 Connecticut towns since 2020. New Haven and Stamford led the net increase in new units, and production accelerated from 2023 to 2025, but even at this current rate, it could take decades to meet the need. With interactive town-level and neighborhood-level maps and downloadable data, this is the most precise picture yet of Connecticut’s housing production gap. See why our community partners have been recommending it to anyone working on housing policy, zoning reform, or town planning.
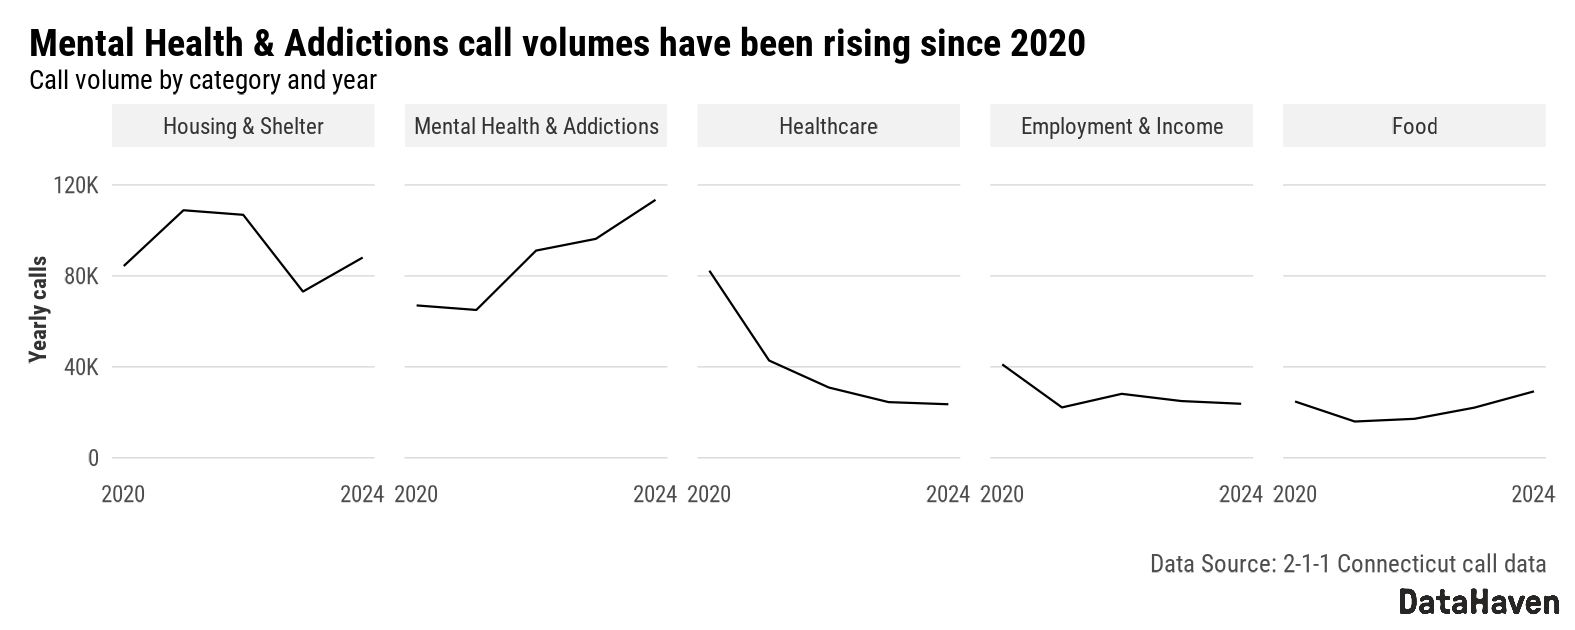
On January 13, 2026, over 1,700 organizations nationwide received sudden termination notices for federal grants, likely including about $100 million in grants to organizations in Connecticut. The suspension of these grants threatened substance use and mental health services that communities depend on. This new report and accompanying maps give advocates, legislators, and providers the data to understand what’s at stake.
Data Office Hours
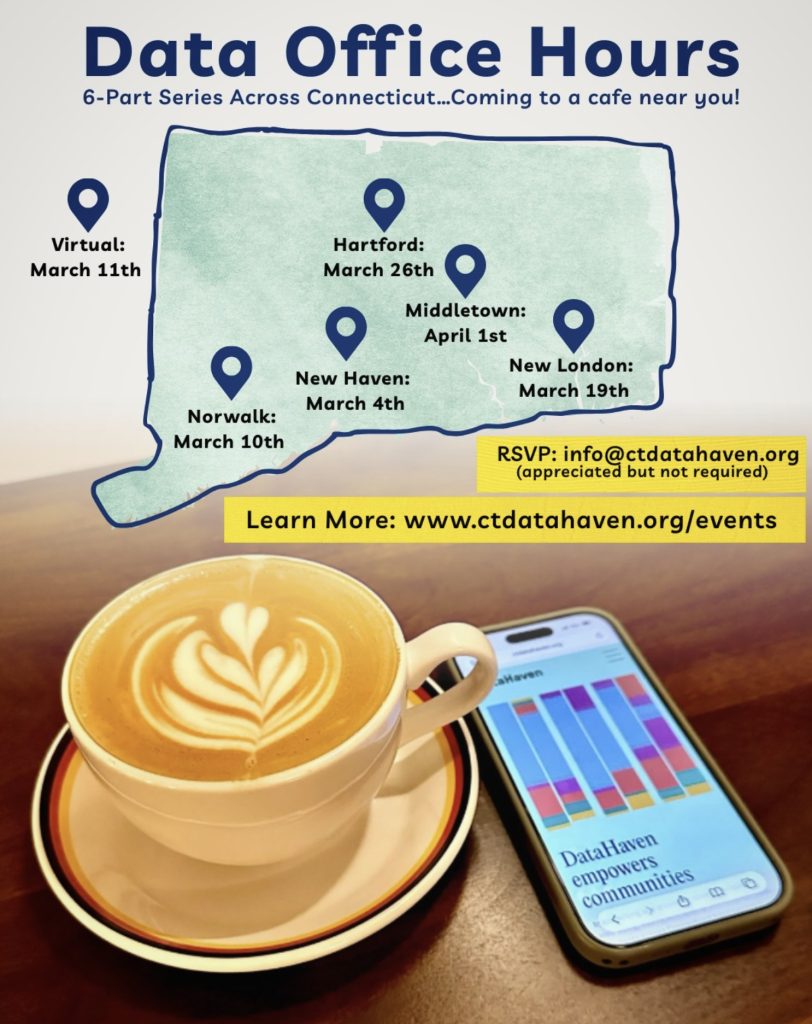
DataHaven is excited to announce Data Office Hours, coming to a cafe near you in Hartford, Middletown, New Haven, New London, and Norwalk, as well as virtually!
Do you have a question about the best ways to find or use data on behalf of your organization? A project you are looking to talk about with data-loving colleagues? Interested in brainstorming or troubleshooting with a data expert? Not sure where to start?
Data Office Hours are open to data enthusiasts of ALL levels of skill and experience and are designed to provide a casual and comfortable space to chat with DataHaven staff over a warm beverage or tasty treat. Come 30 minutes early (where noted in the schedule) to join for a mini data visualization workshop, and stay to connect with DataHaven staff about your data questions. Whether you are looking for technical assistance, a thought partner, or a safe space to get started, Data Office Hours are for you!
An RSVP is appreciated, but not required (except for the virtual session). Please email info [at] ctdatahaven.org to RSVP.
New Haven: Wednesday, March 4, 2026
Location: Book Trader Cafe
Mini Data Visualization Workshop: 11:00am-11:30am
Office Hours: 11:30am-1:00pm
Norwalk: Tuesday, March 10, 2026
Location: Carpe Diem Cafe
Office Hours: 12:00-1:30pm
Virtual: Wednesday, March 11, 2026
Please RSVP to info [at] ctdatahaven.org. Attendees will receive an email with the Zoom link.
Mini Data Visualization Workshop: 4:30-5:00pm
Office Hours: 5:00-6:30pm
New London: Thursday, March 19, 2026
Location: Washington Street Coffee House
Office Hours: 12:30-2:00pm
Hartford: Thursday, March 26, 2026
Location: Story and Soil Coffee
Office Hours: 10:00-11:30am
Middletown: Wednesday, April 1, 2026
Location: Klekolo World Coffee
Office Hours: 2:00-3:30pm
NEW HAVEN, Conn., Jan. 22, 2026 — DataHaven, a New Haven-based nonprofit that has led community data collection in Connecticut for over 30 years, has launched a newly redesigned website and released updated Town Equity Reports for all 169 Connecticut towns, at a time when its recent analyses of federal tax changes continue to receive widespread media and policymaker attention across the state.
The new website features a streamlined design and improved search capabilities, including expanded “Key Facts” sections within the Community Profile pages. The updates are intended to make essential town- and region-level data easy to access with just one or two clicks, on both desktop and mobile devices.
At the same time, DataHaven announced the release of a new edition of its Town Equity Reports, which are used by residents, educators, advocates and policymakers statewide. The reports provide local-level data that are not available from other public sources, and include dozens of new indicators focused on health, housing and quality of life. These indicators were developed in partnership with DataHaven’s Advisory Council.
The Town Equity Reports are available for all 169 Connecticut towns.
DataHaven is presenting the updated reports and website through classroom visits, briefings, webinars and public events around the state, and is seeking opportunities to partner with organizations interested in using the data for research, planning or community engagement.
In late December, DataHaven released a separate report analyzing the town-by-town impacts of federal tax changes under the “One Big Beautiful Bill” (H. R. 1). Titled “$15,000 for Darien families, $700 for Hartford: Mapping the Unequal Effects of H.R.1 Tax Relief in Connecticut,” the report includes interactive maps and downloadable data showing projected effects across Connecticut communities.
The tax policy analysis follows DataHaven’s widely used 2025 publications on the town- and legislative district-level impacts of H. R. 1 on Medicaid and SNAP. The new findings were extensively cited by local and state elected officials, and generated tens of thousands of views on social media. The analysis was featured in front-page coverage by The Day, CT Mirror, and all Hearst Connecticut newspapers.
According to the tax report, households in the top 25 percent by income in Greenwich, Darien, New Canaan and Westport are projected to receive more than $30,000 per family per year in tax relief, on average. By contrast, households in the bottom 25 percent of Greenwich’s income distribution are projected to lose an average of $30 annually.
Statewide, the top 25 percent of Connecticut households by income are projected to gain a combined $3.4 billion per year, or about $10,000 per family on average, while the bottom 25 percent are projected to lose $148 million annually, or $417 per family.
The estimates do not account for higher household costs resulting from tariffs enacted last year. The Yale Budget Lab estimates those tariffs will increase costs by about $2,000 to $8,000 per year for the average U.S. household.
The full tax report is available at ctdatahaven.org/taxrelief2025.
DataHaven is a nonprofit organization with a 30-year history of public service to Connecticut. Its mission is to empower people to create thriving communities by collecting and ensuring access to data on well-being, equity and quality of life. DataHaven is a formal partner of the National Neighborhood Indicators Partnership.
A new DataHaven report has town-by-town interactive maps showing how tax policy changes in the “One Big Beautiful Bill” will impact families in Connecticut:
-Statewide, the top 25% of households by income will receive nearly $10K each in tax relief (a total gain of $3.4 billion every year), with much of that going to the top 2%.
-The middle 50% of households receive $1,800 each on average.
-Households in the bottom 25% lose an average of $417 each (a total loss of $148 million), due to changes in programs such as SNAP and Medicaid. For families currently receiving those benefits, the negative impacts could be even greater.
-The estimates in our new report do not account for cost increases from tariffs, which the Yale Budget Lab projects will cause a $1,900 to $7,600 loss in disposable income for an average household each year.
What does this look like for your area?
-In Greenwich (as well as in Darien, New Canaan, and Westport), the top 25 percent of households by income receive annual tax relief of more than $30,000 each, on average. Meanwhile, households at the bottom 25% of Greenwich’s income distribution lose an average of $30 each.
-Households in West Hartford collectively see $121 million per year in tax relief – a gain of $4,600 per household on average. Meanwhile, in the neighboring city of Hartford, households collectively see only $36 million in tax relief, or just $700 per household on average. The bottom 25 percent of households within Hartford collectively lose $14.4 million per year, a loss of $1,200 each.
-In the City of New Haven, the top 25% of households get $6,200 each, middle-income households get $500 each, and the bottom 25% of households in the city each lose $1,100 per year, on average. In neighboring Woodbridge, the average household sees $7,700 in tax relief.
-In the Greater New London (SECOG) region, households in the top 25 percent of that region’s income distribution collectively gain $184 million in annual tax relief. At the same time, households in the bottom 25 percent collectively lose $14.1 million per year – with about $6 million of that loss impacting families in Norwich and New London.
“Like DataHaven’s widely-used reports that have mapped the communities where over 150,000 Connecticut adults are projected to lose healthcare coverage and food assistance due to H.R. 1, this new report again reminds us that policy changes can have dramatic impacts at the local level,” said Mark Abraham, Executive Director at DataHaven. “Overall, Greenwich sees around $262 million in tax relief, while Bridgeport (a city more than twice the size) gets $60 million total — but with low-income households within Bridgeport losing over $14 million collectively, each year.”
The new report notes that even if H.R. 1 were repealed, these impacts on wealth inequality would remain. In Connecticut, growing wealth inequality is linked to wide gaps in the quality of public spaces, life expectancy differences, and the worsening of housing affordability and homelessness in the state.
The new report has interactive maps and downloadable data for every Connecticut town and county equivalent area. Please help us share it with your colleagues and neighbors who care about economic and fiscal issues in Connecticut (https://ctdatahaven.org/taxrelief2025).
Hartford, Conn. — At a packed statewide event hosted yesterday by the Hartford Foundation for Public Giving, DataHaven unveiled the results of its latest DataHaven Community Wellbeing Survey (DCWS), believed to be the largest and most comprehensive neighborhood-level wellbeing survey in the United States. The event, attended by civic leaders, health professionals, and nonprofit partners, featured presentations from DataHaven as well as remarks by Hartford Mayor Arunan Arulampalam and Jay Williams of the Hartford Foundation. Data placemats and graphics, along with detailed crosstabs for each 2025 DCWS question, are available at https://ctdatahaven.org/wellbeingsurvey.
The DataHaven survey captures a portrait of residents’ health, economic stability, and community life through interviews with thousands of randomly-selected adults in every Connecticut ZIP Code. The New Haven-based nonprofit organization collaborates with Siena Research Institute to ensure the reliability and consistency of its research methods, which include live interviews in English and Spanish and statistical weighting to accurately represent Connecticut’s entire adult population. Since 2015, more than 53,000 representative adults have participated in these in-depth interviews. For the 2025 survey, 1,371 adults were interviewed from August 4 to October 16, 2025, and the statewide results carried a maximum margin of error of 3.5 percent.
“Connecticut continues to show great resilience and a high quality of life, with more than 83 percent of adults saying they are satisfied with the place they live,” said Mark Abraham, Executive Director of DataHaven. “But the data also reveal areas of concern that communities are working hard to address, including cuts to food assistance, health care, and housing that over a million people in our state have been relying on. The results also show rising anxiety, worries about immigration enforcement, differences in access to economic and health opportunity, and financial stress, especially for renters and families with children.”
Trust in Local Institutions Remains High
The presentation began with a focus on institutional trust, a theme that resonated among the representatives from local and statewide agencies, philanthropies, and healthcare organizations gathered at the event. “Our data show that trust in local and state government remains high, even as trust in federal government has declined,” said Abraham. “This implicit legitimacy of local partners is one of Connecticut’s greatest assets, as it allows communities to respond with credibility as challenges arise.”
Abraham noted that the survey continues to demonstrate a strong link between responsive government and higher self-reported well-being, underscoring the importance of access to trusted local information at a time when the availability of reliable data has been threatened nationally.
A Collaborative Effort
The survey is made possible through a broad coalition of partners. This year, major supporters include the University of Hartford, American University, and Yale University, Connecticut Children’s, Yale New Haven Health, the Connecticut Department of Public Health, local health departments in Hartford, New Haven, and Stamford, and regional philanthropic organizations including The Community Foundation for Greater New Haven, Connecticut Community Foundation, The Connecticut Project, Fairfield County’s Community Foundation, Hartford Foundation for Public Giving, United Way Coastal Fairfield County, United Way of Greater New Haven, and the United Way of Connecticut, with many other organizations contributing as well.
“This diversity of organizations supporting the survey reflects the fact that the survey measures what matters most to quality of life, whether that is community trust, transportation, affordability, health, housing, or support from friends and family,” Abraham said at the event.

Major Changes Since Prior to the COVID-19 Pandemic
The presentation highlighted the largest statewide changes measured by the DataHaven survey between 2018 and 2025.
• Cannabis use doubled, with about 350,000 more adults now using cannabis or marijuana (24 percent of adults using it at least once during the last 30 days, up from 12 percent in 2018).
• Optimism about local jobs increased and underemployment rates improved somewhat, with 250,000 more adults in Connecticut rating employment opportunities for residents in their area as “excellent” or “good.”
• Mental health challenges rose, with about 200,000 more adults reporting anxiety or depression.
• Chronic disease diagnoses rose, with about 150,000 more adults reporting diabetes or hypertension, potentially reflecting both an aging population and improved screening.
• The number of adults who ran out of money for housing, and the number who had to stay home in the past year because they lacked reliable transportation, both increased by roughly 150,000 adults. In 2025, 11 percent of adults statewide (about 320,000 people) said they ran out of money for housing, which is about double the rate that was measured by the DataHaven survey 10 years ago. Statewide, 7 percent of adults said they had to miss doctor’s appointments because they had no way to get there.
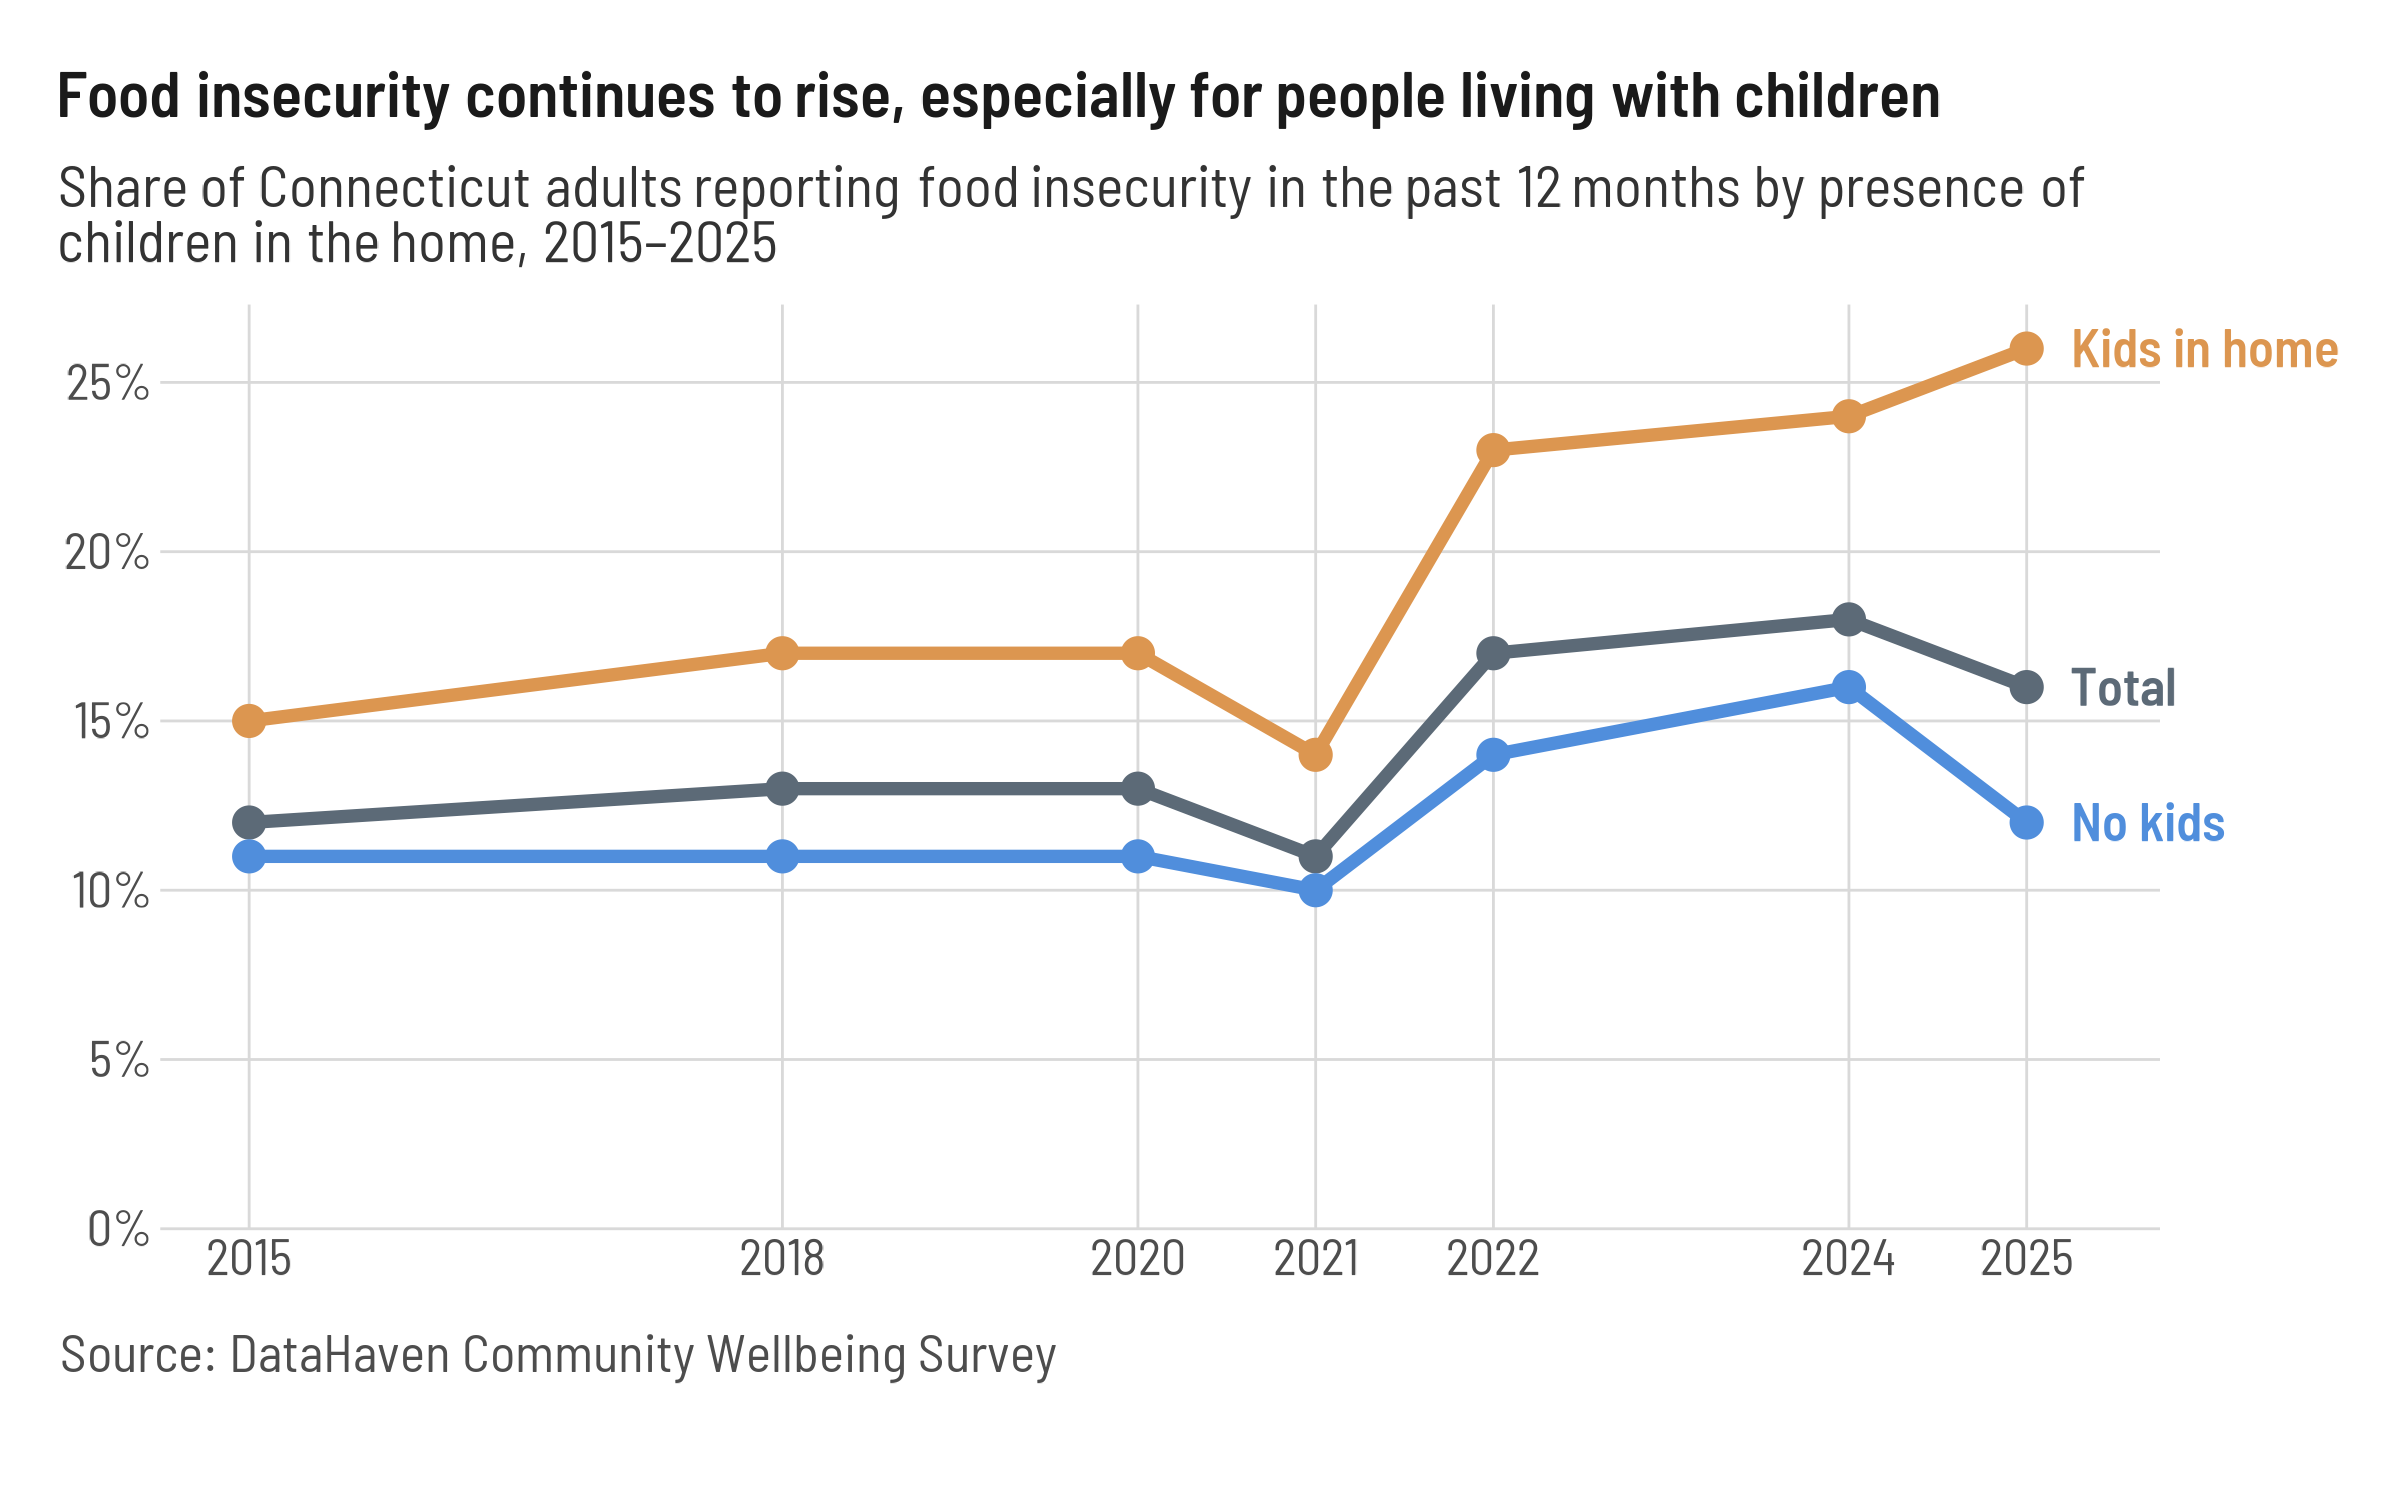
• Food insecurity is rising, increasing by 100,000 adults from pre-pandemic levels. The increase is particularly large for adults living with children (with 26 percent reporting that they ran out of money for food in the past year, compared to 11 percent of adults without children). Abraham noted that this increase is even more striking if compared to 2021’s record low in the food insecurity rate, when the expanded Child Tax Credit helped families and slashed child poverty nationally. In some of Connecticut’s largest city centers, up to half of adults with children report that they ran out of money for food this past year.
• Access to care remains an issue, with 100,000 more adults unable to get needed medical treatment in the last year. The rate of missed care spiked during the peak year of the COVID-19 pandemic and has since improved for higher-income adults but continued to worsen among moderate- and lower-income residents.
• About 100,000 fewer adults in the state smoke cigarettes, though this is partly because vaping has become more popular, especially among younger adults.
• About 150,000 additional residents say they have safe places to ride bicycles, likely reflecting the construction of new protected bike paths in many towns.
• Social support declined, especially for adults with below-median incomes, with 100,000 fewer adults saying they usually receive the social or emotional support they need.
Despite these shifts, Abraham emphasized that “most measures have remained stable over time, meaning that Connecticut continues to outperform national averages on many dimensions of health and well-being.”


Key Topics Shared at the Event


The presentation covered several additional findings from this year’s data:
• SNAP and the Social Safety Net: In 2025, new questions were added on public benefits. The survey found that 26 percent of Connecticut adults or their household members have received SNAP at some point, 36 percent have received Medicaid/HUSKY, 9 percent received rental housing assistance, and more than 1 in 10 used a food pantry in the past year. The survey also found that of the adults who received SNAP within the past 30 days, the majority had not used a food pantry or emergency food service at all within the past year. “These numbers help communities understand who depends on safety net programs, and how policy changes like the pause in SNAP benefits are likely to drive a huge increase in demand at food banks,” Abraham said. The survey also examined residents’ attitudes about public programs, finding that most say that there is not enough assistance for low income people, and that most residents are concerned that current national policy changes will lead to more people going hungry or unable to access health care or housing.
• Immigration Concerns: The survey included questions about the personal and community effects of immigration enforcement. In Connecticut, 31 percent of all adults worry “somewhat” or “a lot” that they or someone they know could be detained, deported, or have their legal immigration status revoked. Many residents, particularly Latino adults, reported heightened stress, lost sleep, and delayed medical care related to these concerns. “Even before new policies take effect that will dramatically increase the federal budget for immigration enforcement and deportations, many residents are already feeling an impact on their health and well-being,” Abraham noted.
• Eviction and Criminal Justice: A new survey item showed clear disparities in evictions by incarceration experience, suggesting a need for policy interventions that reduce the barriers to stable housing for people with past justice involvement.
• Mental Health: About 13 percent of all adults, including 22 percent of young adults, reported needing mental health treatment within the past year but being unable to get it, often due to cost or lack of available services.
• Social Support: Abraham noted that this single measure of how much support people feel from family and friends predicts happiness and well-being more than any other item in the survey. “The increase in loneliness is something we should take seriously, and we should consider what we can collectively do to support each other in our state,” he said.

Data Access and Next Steps
The 2025 DCWS Connecticut Crosstabs, along with graphics and “Data Placemats,” were distributed to attendees and are publicly available at ctdatahaven.org/wellbeingsurvey. Survey data are also accessible in DataHaven’s town reports and its Connecticut Town Data Viewer, which combines results since 2015 to provide neighborhood-level insights for each of the 169 towns in the state. DataHaven encourages partners and advocates to reach out for analyses or presentations that can bring the findings to life at the local level.
Media Contact
Mark Abraham, MPH, Executive Director, DataHaven, Email: info [at] ctdatahaven.org, Phone: (203) 500-7059.

Today, DataHaven released a new report titled “Food Assistance and Local Economies at Risk: Projected Federal SNAP Cuts by Connecticut Town and District,” analyzing projected losses of Supplemental Nutrition Assistance Program (SNAP) benefits tied to recent federal policy changes. According to a July 2025 report from the Urban Institute, 58,000 families in Connecticut are expected to lose at least $25 per month in SNAP benefits, with these families experiencing an average monthly benefit loss of $194. Overall SNAP benefits losses throughout the state will total between $11M and $15M each month.
The new DataHaven report provides town- and legislative district-level estimates across Connecticut. For example, in Hartford, about 6,000 families are expected to lose $25 or more in monthly SNAP benefits, with benefit losses totaling between $1.1M and $1.6M each month. Bridgeport, New Haven, and Waterbury are each projected to see over 4,600 families losing $25 or more in monthly benefits, adding up to total benefit losses of between $890,000 and $1.3 million per month in each city. Impacts will reach beyond urban areas, too. In the state’s northeast corner, 1,700 families from State Senate District 29 stand to lose at least $25 per month, with benefit losses in that area totaling $330,000 to 440,000 per month.
These projected losses stem from federal legislation (the “One Big Beautiful Bill Act”), which introduces work requirements, administrative hurdles, and additional cost burden for states. Under the new law, even as Connecticut pays more to sustain its SNAP program, residents are likely to see essential nutritional benefits diminish or disappear entirely.
The report includes links to interactive data visualizations and colorful maps, showing impacts at the town and legislative district level. Visit the DataHaven website, at ctdatahaven.org/snapcuts, to read the full report.
Researchers and policy experts from DataHaven, The Connecticut Project Action Fund, End Hunger CT, and other statewide organizations are available to comment on the report.
“People in every corner of our state are being crushed by the cost of living, and as this data shows, federal SNAP changes are only going to make that worse,” said Meghan Holden, Director of Marketing and Communications for The Connecticut Project Action Fund. “Right now, 58,000 Connecticut households are at risk of losing an average of $194 per month in SNAP benefits. That money is the difference between a child going to bed with an empty belly or full, between a veteran eating one meal a day or three, between hunger and survival. Our state has to call a special session and broaden and fund the federal safeguard account to protect working class people from SNAP cuts, now.”
“Feeding hungry people should not be a political problem. Food is the most basic building block for a healthy, thriving community. When we cut SNAP, we’re not just cutting benefits — we’re cutting stability, long-term health, and opportunity. Food is medicine. Food is educational success. Food is jobs. Every dollar invested in SNAP pays dividends in healthcare, education, and economic resilience,” said Meg Hadley Zimmerman, Program Manager at End Hunger CT!.
“These cuts to SNAP benefits are coming at a time when rates of food insecurity in Connecticut have reached historic highs, putting even more pressure on families and local main streets alike. This new report is important because it provides town- and district-level estimates that can help legislators and advocates understand the on-the-ground impacts of recent legislation,” said Mark Abraham, Executive Director at DataHaven. “In addition to putting food on the table and ensuring that all children have the nutrition they need to succeed, SNAP benefits keep dollars flowing through neighborhood businesses and help support local jobs. These data make it clear how cutbacks in SNAP as a result of work requirements and other federal policy changes are going to have a significant impact on communities across the entire state.”
Today, DataHaven released a new report titled “Coverage at Risk: Projected Losses in Medicaid and Access Health CT by Town and Community,” analyzing the projected reductions in health insurance coverage tied to recent federal policy changes (see ctdatahaven.org/coverageatrisk
The report provides town- and legislative district-level estimates across Connecticut. For example, in Hartford, 13,000 residents are expected to lose Medicaid, equivalent to 11 percent of that city’s entire population. In the state’s northeast corner, about 5 percent of the total population of State Senate District 29 (4,700 out of 101,000 people) stand to lose their Medicaid coverage, and in rural State Senate District 30, which covers most of Litchfield County, about 3,800 people (4 percent of the total population) are projected to lose coverage. Disaggregations by income, race/ethnicity, household type, and place of birth are included in the report.
These projected losses stem from federal legislation (the “One Big Beautiful Bill Act”), which introduces administrative verification hurdles, work requirements, and stricter eligibility restrictions. Without intervention, coverage losses could raise healthcare costs for all Connecticut residents, strain safety-net institutions, and widen health disparities.
The report includes links to interactive data visualizations and colorful maps, showing both the absolute number and share of the population impacted. Visit the DataHaven website, at ctdatahaven.org/coverageatrisk
Researchers and policy experts from DataHaven, Health Equity Solutions, United Way of Connecticut, and other statewide organizations are available to comment on the report.
“Healthcare coverage is a foundation for community well-being,” said Mark Abraham, Executive Director at DataHaven. “Due to recent changes in federal policy, hundreds of thousands of Connecticut residents are at risk of losing access to affordable care. Without action, these losses will not only threaten individual health, but will deepen inequality in our state and strain the ability of our healthcare system to provide affordable care. The local estimates in this new report make clear how federal decisions can have major consequences for Connecticut families and communities, both in rural areas as well as in our larger urban regions.”
“Connecticut must act quickly to prevent the coverage crisis by investing in sustained access to care, maintained coverage and ensuring new systems are shaped by the voices of those most impacted,” said Ayesha R. Clarke, Executive Director of Health Equity Solutions.
“We know that Connecticut families will have to shoulder additional costs to maintain their healthcare as a result of these changes. As we reveal in the CT ALICE report this week, this is just one additional expense that will be an impossible burden for hardworking families who already live paycheck to paycheck, struggling to make ends meet,” said Daniel Fitzmaurice, Director of Advocacy at United Way of Connecticut.
New: DataHaven Connecticut Youth Advisory Council
We’re excited to share open roles and positions for our Youth Advisory Council, the new youth-led advisory group at DataHaven. For the 2025-2026 school year, participants will develop data and research skills while helping their communities and providing advice on our many statewide publications, such as our popular Connecticut Town Equity Reports and Town and Neighborhood Data Viewers.
These postings can be found at ctdatahaven.org/careers, or visit our social media pages to learn more and help us share the call for participants:
- Teaching Fellow (part-time, paid position)
- Student Facilitators (stipend)
- Advisory Council Participants (travel stipend). Council participants are entering grades 9-12 or their first year of college.
Help share the word: The 2025 DataHaven Community Wellbeing Survey is underway!
The 8th annual wave of our large statewide survey is underway, with results to be released this fall! Over 53,000 randomly-selected adults in every Connecticut town have participated in interviews, which create local information that isn’t available from any other public data source.
If you are selected to receive a phone call, mail package, or message (a text from 860 area code), please participate! Please also help us share this graphic (also posted on our LinkedIn, Instagram, and Facebook pages) so that neighbors are aware.

New reports from across Connecticut
Recently-published reports by DataHaven, in partnership with organizations across the state, include:
- 2025 Valley Community Index
- Economic Contributions of Immigrants in CT
- 2025 Greater Hartford Community Focus Groups Summary Report
- The Upside: Unlocking Fairfield County’s Potential
Stay tuned for new reports this fall! Our data continue to shape news across the state, for example:
- LGBTQ+ Communities Under Pressure: https://www.courant.com/2025/07/14/cts-lgbtq-communities-are-under-new-p…
- Immigrants Power CT’s Economy: https://www.courant.com/2025/07/14/trump-deportation-plan-could-be-devas…
- CT Paid Leave and Housing Insecurity: https://ctpaidleave.medium.com/home-for-the-holidays-ct-paid-leave-provi…
- Is Connecticut a Great Place to Be a Child? https://ctmirror.org/2025/08/03/paid-post-is-connecticut-a-great-place-t…
- Rural Health Barriers: https://www.ctdatahaven.org/blog/mobile-solution-rural-health-barriers-c…
- Childcare: https://www.ctdatahaven.org/blog/study-child-programs-are-available-staf…
- Legislative Leaders React to DataHaven Survey: https://www.ctdatahaven.org/blog/legislative-leaders-react-survey-indica…
DataHaven regularly provides data trainings and workshops for community-based organizations and agencies. Please reach out if you’re interested in custom briefings on these new reports and other data we collect!
New Haven, CT – A new report published by DataHaven and The Connecticut Immigrant Support Network shows how immigrants are critical to Connecticut’s economy—supporting major industries, driving entrepreneurship, and contributing billions in tax revenues and consumer spending.
Titled “The Economic Contributions of Connecticut’s Immigrant Community,” the publication highlights that immigrants make up 15% of the state’s population but hold about 20% of all jobs. Immigrant workers are critical to sectors like construction, agriculture, health care, and early childhood education, and also account for 26% of the state’s entrepreneurs. It also notes that immigrant-led households in Connecticut wield approximately $22 billion in spending power, which supports businesses and jobs across the state.
“Connecticut’s prosperity, both economically and otherwise, is closely tied to the contributions of its immigrant communities,” said Mark Abraham, Executive Director of DataHaven.
The report encourages Connecticut lawmakers to continue to pursue policies that welcome immigrants. It warns that deporting undocumented immigrants—who make up 3% of the state’s population—could have catastrophic consequences to the state’s economy. For instance, 87% of undocumented immigrants in Connecticut are of working age, and they contribute about one billion dollars in federal, state and local taxes each year.
“At this critical point in time, it is imperative to understand that undocumented immigrants contribute significantly to Connecticut’s economy by participating in the workforce, by paying taxes, and by spending their money locally. Our state is more diverse and vibrant because of their presence,” said Tabitha Sookdeo, Executive Director of CT Students for a Dream, and a representative of The Connecticut Immigrant Support Network.
“Connecticut employers have long supported legal immigration, recognizing the contributions immigrants have made to our long legacy of innovation and the ongoing contributions to our economy,” said Chris DiPentima, President and CEO of CBIA, the state’s largest business organization. “Immigrants bring essential skills that complement our workforce, filling labor shortages across a wide range of industries, helping drive productivity gains and job creation and making Connecticut’s economy more competitive.”
The full report is available for download online at https://www.ctdatahaven.org/reports/economic-contributions-connecticuts-immigrant-community.
By Andrew Carr, Kelly Davila, and Mark Abraham, DataHaven

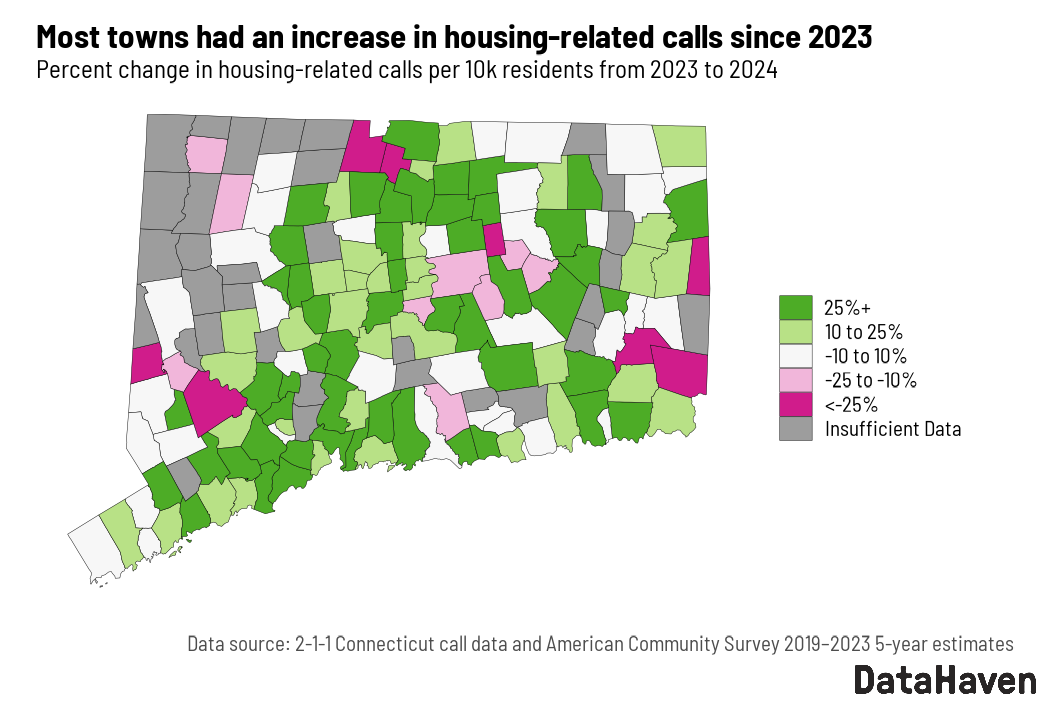
The number of calls to United Way’s Connecticut 211 that requested assistance for food, housing, and mental health needs increased from 2023 to 2024. Maps created by DataHaven show that calls increased in towns all over the state.
In some areas, the increase in call volumes tracks with needs that can be observed in other datasets. For example, rates of food insecurity and housing insecurity among Connecticut adults both hit all-time highs in the 2024 DataHaven Community Wellbeing Survey, which has been tracking those indicators statewide since 2015. Food insecurity rates were much lower in 2021, particularly among families with children; families received an expanded federal child tax credit during that year.
The DataHaven report also finds that calls are higher among women. This could relate to gender inequities, as women report significantly higher rates of financial need statewide when compared to men, according to DataHaven’s 2024 survey. For example, in 2024, 21 percent of women, 14 percent of men, and 32 percent of nonbinary adults statewide reported that they had been unable to afford food at times during the past year.
The 211 call data analyzed by DataHaven could allow policymakers to better understand how the need for assistance is related to other data. The data in this report may differ from the data presented elsewhere due to the ways we deduplicate call records and call requests. For the purposes of this section, a “call” refers to a single caller, who may have many needs. A “request” is an individually-tagged program or service the caller is in search of.

Looking in-depth at calls for shelter assistance

According to our analysis, 211 Connecticut received more than 62,000 calls for shelter-related assistance in 2024, comprising 71 percent of all calls associated with a housing need, and 18 percent of all calls received across the state.
Homelessness has been increasing annually in Connecticut and nationally. In fact, 2024 was the year with the highest rate of homelessness ever recorded in the United States, with an estimated 771,480 Americans experiencing homelessness, including 3,410 Connecticut residents, according to a December 2024 report by the U.S. Department of Housing and Urban Development. In Connecticut, an estimated 32 percent of homeless people were families with children and 5 percent were unaccompanied youth. These are, however, likely undercounts of the homeless population due to data being collected on only one night per year.
The increasingly limited supply of housing combined with rapidly rising prices during the past decade means that more and more renters may find themselves in need of emergency housing assistance, such as shelters. For example:
● Zillow found that rents in the Greater Hartford area rose by nearly 8 percent from 2023 to 2024, the fastest increase of any major metropolitan area in the United States.
● Data from the Census Housing Vacancy Survey show that Greater New Haven had the second-lowest rental vacancy rate of any metropolitan area in the United States between January 2023 and September 2024, with just 2.90 percent of units vacant, with Fairfield County ranking third in the nation at 2.92 percent, and Greater Hartford not far behind at 4.28 percent.
● In 2024, the DataHaven Community Wellbeing Survey found that 12 percent of adults had trouble paying for housing costs at some point in the past year, an increase from 6 percent of adults in 2015. Fourteen percent of adults with children at home and 18 percent of renters struggled to cover housing costs in 2024.
Homelessness is often the result of continuous housing instability that is largely preventable with the right combination of counseling and social assistance. 211 Connecticut houses a Coordinated Action Network (CAN) platform that connects callers facing housing insecurity or loss of housing through evictions or other circumstances with services that can help them.
On the whole, DataHaven’s analysis of the 211 Connecticut call data show that call rates for shelter are highest in Connecticut towns where at least 30 percent of households are renters. As the share of renters grows, so too does the rate for shelter assistance calls. Furthermore, the rate of calls for shelter assistance increases somewhat with the ratio of rent to income, though many towns with relatively modest rent-to-income ratios also have high call rates. Towns across the state, including urban centers like Bridgeport, Hartford, and New London, suburban towns like Vernon, Enfield, and Milford, smaller urban areas like Torrington, Meriden, Middletown, and the Lower Naugatuck Valley, and several rural towns in Eastern Connecticut, all have high call rates for shelter assistance (see map).
All of this speaks to a deep need statewide for affordable housing. A low supply of available housing has quickly increased the cost of both rental units and single-family homes. As a result, thousands of Connecticut residents are reaching out for housing assistance each month.
Methods
For this analysis, DataHaven used Connecticut 211 call data provided by the United Way of Connecticut. The dataset’s unit of analysis is call need – each row represents a unique call need, and individual calls may appear multiple times if attributed to more than one need. The data were deduplicated to remove multiple entries from the same caller within the same need category. Yearly call volumes represent the total number of calls each year. Call rates are the number of calls per 10,000 residents in a given area. Population estimates are based on the Total Population (B01003) table from the 2019-2023 American Community Survey (ACS). In the maps, call rates were suppressed for towns with fewer than ten calls in either 2023 or 2024. This analysis does not include requests that were made via the 211 website.
by DataHaven Staff

(Screenshot from January 31, 2025, 9:40pm)
The recent move by the federal government to remove thousands of publicly-funded web pages and datasets is a threat not just to our work at DataHaven, but to the many non-profits, health care researchers, and resident advocates collectively working toward healthier, more equitable communities. We rely on having accessible, trustworthy data from these federal agencies, but the impact goes far beyond that. The datasets currently under fire inform many aspects of our lives, from understanding health trends to funding schools and transportation to directing pandemic relief.
There’s little being done to hide this being an ideological purge, complete with lists of banned words. Recently, when we tried to update important public health indicators from the CDC, such as rates of asthma and diabetes, we were instead met with a notice that the data portal was down pending compliance with an executive order to protect women from “gender ideology”. This dataset has no mention of gender identity, but it does, ironically, have rates of women’s health screenings, as well as economic measures like food insecurity that tend to impact women and children more. Other data deemed too inclusive include the tables from a major youth survey, a key tool for school districts to track trends in youth substance use, bullying, and suicidality, as well as the CDC’s social vulnerability index, used by FEMA and local agencies to identify areas with more seniors or car-less households for disaster planning and evacuation.
Very few datasets contain any information about gender identity. Very few Americans identify as transgender (we estimate about 1 percent of Connecticut adults do). From the data we do have, we see trans adults in Connecticut and elsewhere generally being at greater risk of depression, anxiety, and financial hardship.
No one is made safer or healthier by being “protected” from those facts. It’s not really about the data: this is a move to further politicize basic health information, and to explicitly scapegoat, criminalize, and inflict harm on our trans community members, with dangerous precedent. When we allow basic concepts of equity to be outlawed and women’s health to be used to further marginalize LGBTQ people, we all lose.
We believe in data as a powerful tool—for knowledge, for advocacy, and for accountability. We are seeing first-hand what can happen when public information—or its censorship—is weaponized, and it stands to harm us all. We don’t know how this will play out over the coming months and years, but we know that we and our allies are clever, determined, and prepared with backups.