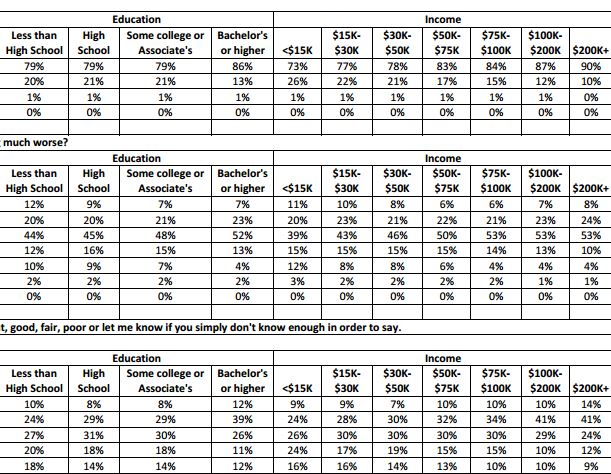
All Tags

  • NHCity-Neighborhood-Profiles-2013

    This is a raw dataset with neighborhood profile data from 2010 for New Haven. For our main New Haven Neighborhood Profiles page, click here. For the New Haven Neighborhood 2010 map, click here.  

    September 04, 2015

  • Table: 2010 Census New Haven Neighborhood Profiles

    This is a PDF table of New Haven neighborhood profiles generated via 2010 Census data, identifying key demographic and economic indicators at the neighborhood level. Please view our main New Haven neighborhood profiles page for additional information.

    September 02, 2015

  • DataHaven Consultation Award 2015

    More statewide and national recognition for DataHaven

    Read below for an excerpt from our semi-annual newsletter, released in August 2015. The newsletter also contained links to the many new reports that DataHaven has published. Contact us to sign up for the full newsletter!

    September 02, 2015

  • Immigration map showing countries of origin within the Greater New Haven metropolitan area population.

    Understanding the Impact of Immigration in Greater New Haven

    About this report With one in eight of its residents foreign-born, Greater New Haven has a diverse immigrant population that has contributed significantly to regional growth and development. Commissioned by The Community Foundation for Greater New Haven, DataHaven analyzed the recent demographic, social, and economic impact of immigration in the region.

    August 31, 2015

  • Racially Concentrated Areas of Wealth and Poverty DataHaven

    Concentrated Wealth and Poverty in Connecticut's Neighborhoods

    [Note: The interactive map that was on this page is no longer active. Please view our Community Index Reports and Data Dashboard for more recent maps] Wealth and poverty are highly concentrated in Connecticut — more so than in many other large metropolitan areas. And often, those neighborhoods are racially and economically segregated from each other. For example, 27 percent of top-earning households live in neighborhoods that are predominantly white and wealthy. In other large metropolitan areas, it’s just 10 percent.

    August 31, 2015

  • Racially Concentrated Areas of Poverty Connecticut Data by DataHaven

    Connecticut Data Map: Racially and Economically Segregated Areas, 2012

    [Note: This map is no longer active. Please view our Community Index Reports and Data Dashboard for more recent maps] Connecticut not only has the highest per capita income in the nation and ties New York in income disparity, its pockets of wealth and poverty are more highly concentrated than in many other large metropolitan areas.

    August 26, 2015

Pages