Mapping the Local-Level Impacts of a Proposed Renter’s Tax Credit in Connecticut
By Andrew Carr, PhD, and Mark Abraham, MPH, DataHaven
Introduction
Renters in Connecticut are experiencing the worst housing affordability crisis in decades. Fifty percent of renter households are cost burdened, meaning they spend 30 percent or more of their income on housing. More than half of these households are severely burdened, spending at least 50 percent of their income on housing. Severe cost burden is common for renters in urban, suburban, and rural parts of Connecticut. Additionally, homelessness has risen sharply since 2021 due to the high cost of housing, and since 2015, the share of all Connecticut adults reporting that they ran out of money to pay for housing within the past year doubled from 6 percent to 12 percent (this rate is significantly higher for renters, especially those with children).
The state legislature is considering a renter’s tax credit that would return money to lower-income renter households. This credit is designed to reduce families’ net housing costs, and lower rates of housing cost burden across the state. Some other states have renter’s tax credits or are considering them. For example, according to the Minnesota Budget Project, more than 310,000 Minnesota households received that state’s Renter’s Credit in 2023, and the average amount of credit received was $855.
DataHaven analyzed U.S. Census Bureau data to understand how a proposed renter’s tax credit would impact communities in Connecticut. We estimated the total credit and number of households that would be eligible, the average credit that renters would receive, the share of renter households that would be eligible, and how these amounts would vary across towns, legislative districts, and racial and ethnic groups.
At the time of writing this report, there were multiple bills proposing a renter’s tax credit, with varying subsidy amounts and eligibility guidelines. This report is focused on bill language in HB5114 that has a maximum credit amount of $2,500 per year. Eligible renters would include single-filer households making less than $75,000 per year, and joint-filer households making less than $150,000 per year. Following language in one of the proposed bills, we assumed the credit amount would equal 20 percent of a renter’s annual rent minus 4 percent of their adjusted gross income (AGI). This is roughly similar to the share of rent that is believed to go towards landlords’ property taxes each year, according to a range of different estimates.
We used the 2020–2024 American Community Survey to estimate rents and incomes for households that would be eligible for this credit. We applied these amounts to the credit formula to estimate credits for each household (see the Methodology section for more information).
Findings and Interactive Maps
Our analysis finds that 314,000 households across Connecticut (comprising about 65 percent of total renter households in the state) would be eligible for the proposed credit. These renters would receive a total of $528 million annually. To help illustrate the impact of the credit across all renter households, we calculated the average credit in each area. Renter households in Connecticut can expect to receive an average of $1,100 per year. The average credit is the total credit divided by the number of renter households; this average figure includes renter households that are not eligible for the credit.
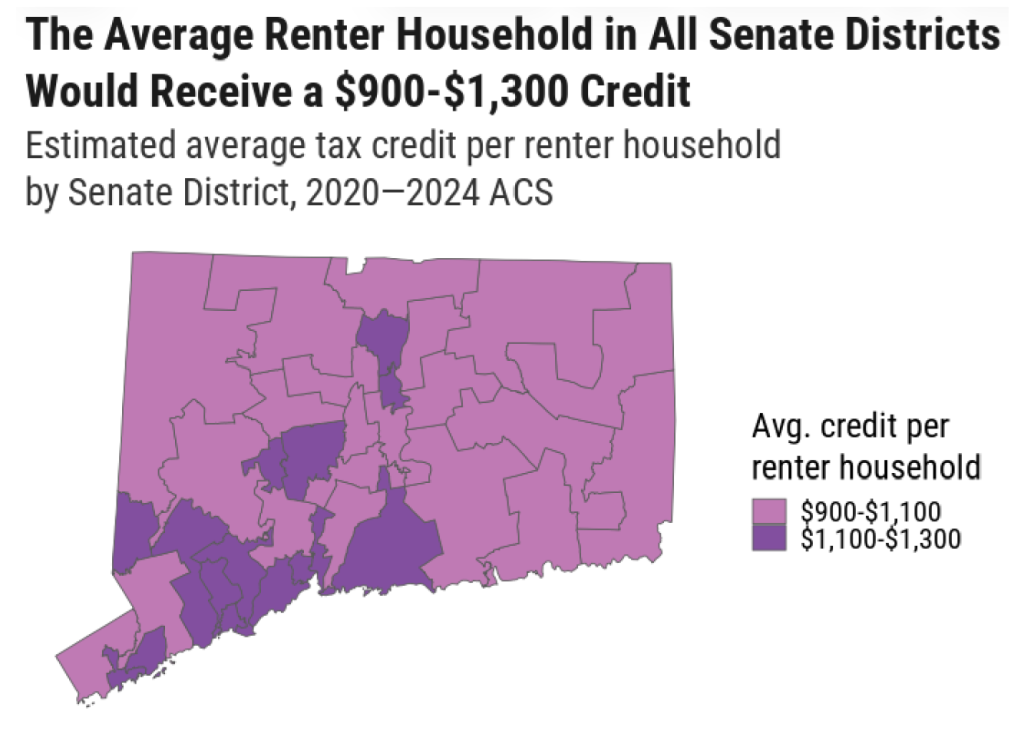
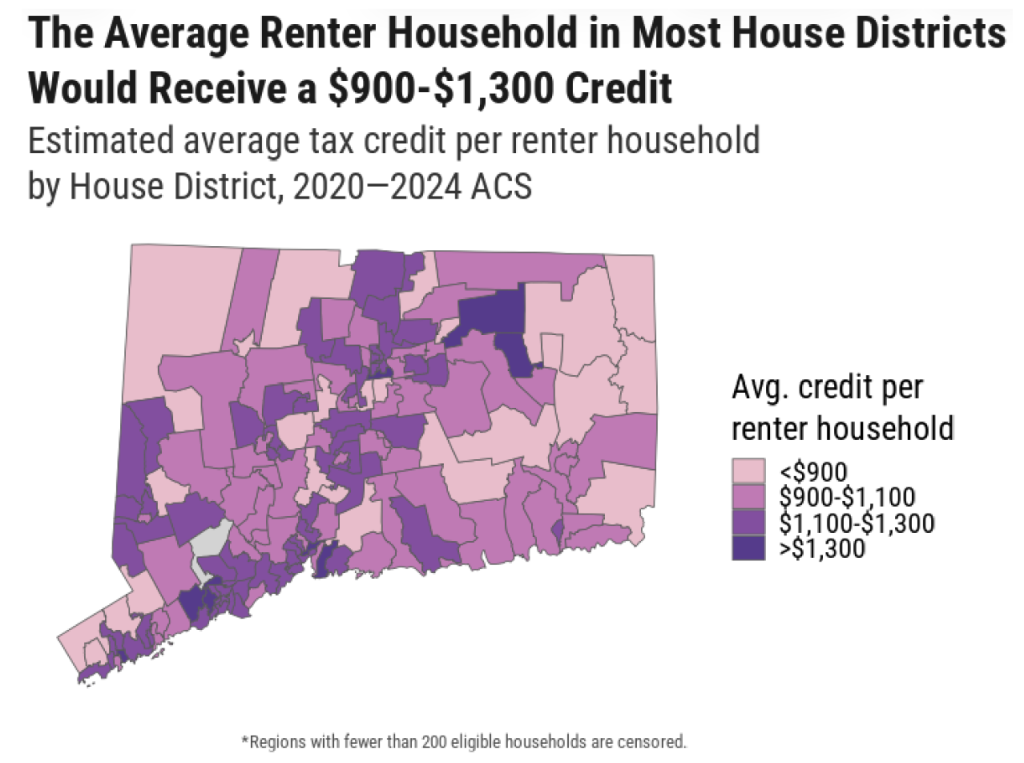
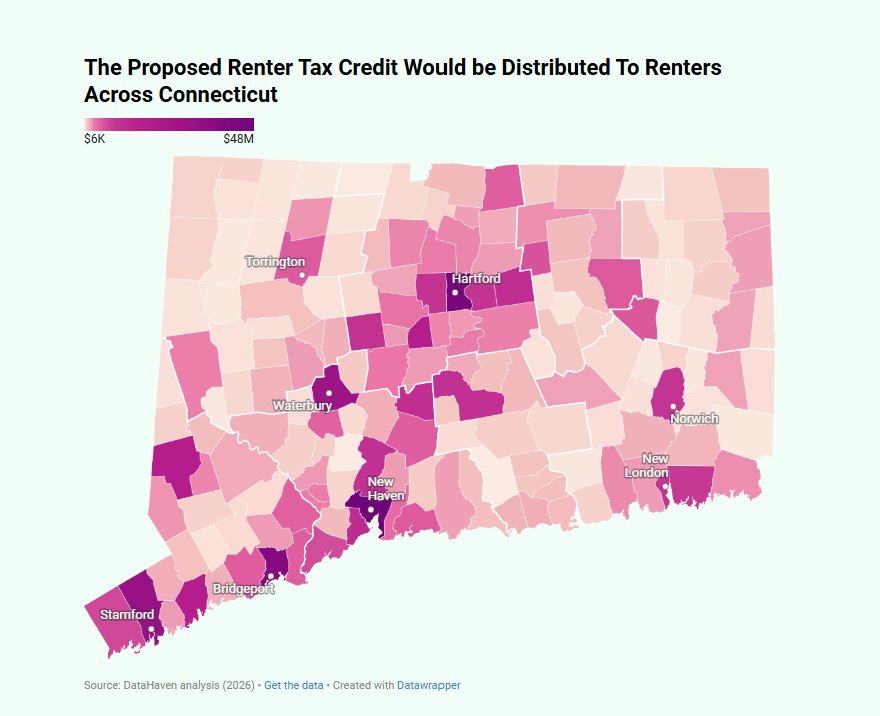
These maps show DataHaven’s estimates of the total credit amounts among renter households in Connecticut towns and legislative district. Hover over the maps to view the average credit amount and share of renter households who would be eligible for the credit. Additional maps are available at the bottom of this page.


In most Connecticut towns, we predict that the average renter household would receive a credit between $900 and $1,300 per year. The towns that would receive the largest total credits are New Haven ($48 million), Hartford ($45 million), Bridgeport ($39 million), Stamford ($32 million), and Waterbury ($29 million), but this is primarily because they have the highest concentrations of renter households.
Many State Senate districts would receive total credits of more than $13 million, including State Senate Districts 4, 18, 20, and 29 in eastern Connecticut. The northwest corner of Connecticut would receive about $18 million, if combining State Senate Districts 8 and 30. At the geographically smaller State House district level, areas receiving total credits of more than $7 million each include District 39 in New London, District 146 in Stamford, District 110 in Danbury, and District 25 in New Britain, in addition to at least two districts in each of the state’s four largest cities.
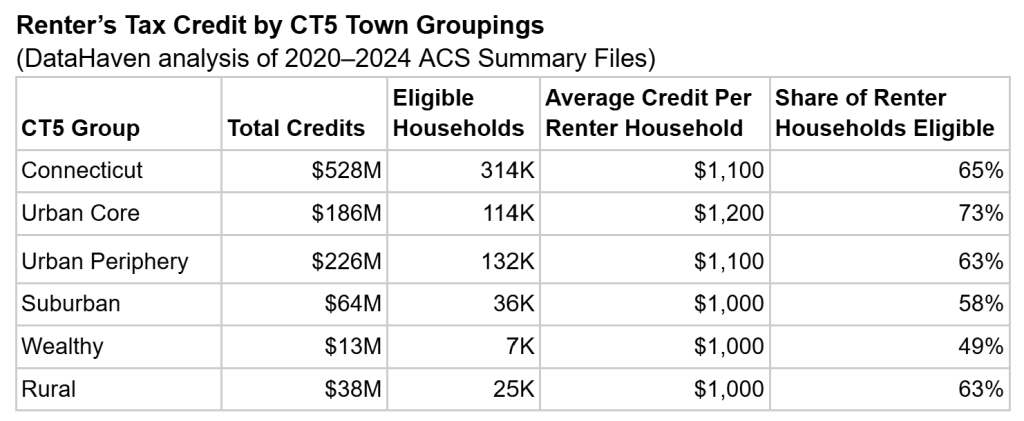
A comparison of credit amounts across the “5 Connecticuts” (CT5) shows that credit amounts would vary to some degree for different kinds of towns. The CT5 regions are groups of towns defined by their sociodemographic characteristics. While we predict that the average renter household in Urban Core and Urban Periphery towns would receive $1,200 and $1,100 credits, respectively, renter households in Suburban, Wealthy, and Rural towns would receive $1,000 credits. The lower averages in Suburban and Wealthy towns can be attributed to lower shares of eligible renters in these regions. While 73 percent of renter households in Urban Core towns would be eligible for the credit, 63 percent of renter households in Rural towns, 63 percent of renter households in Urban Periphery towns, 58 percent of renter households in Suburban towns, and 49 percent of renter households in Wealthy towns would be eligible.
Renter’s Tax Credits by Race and Ethnicity
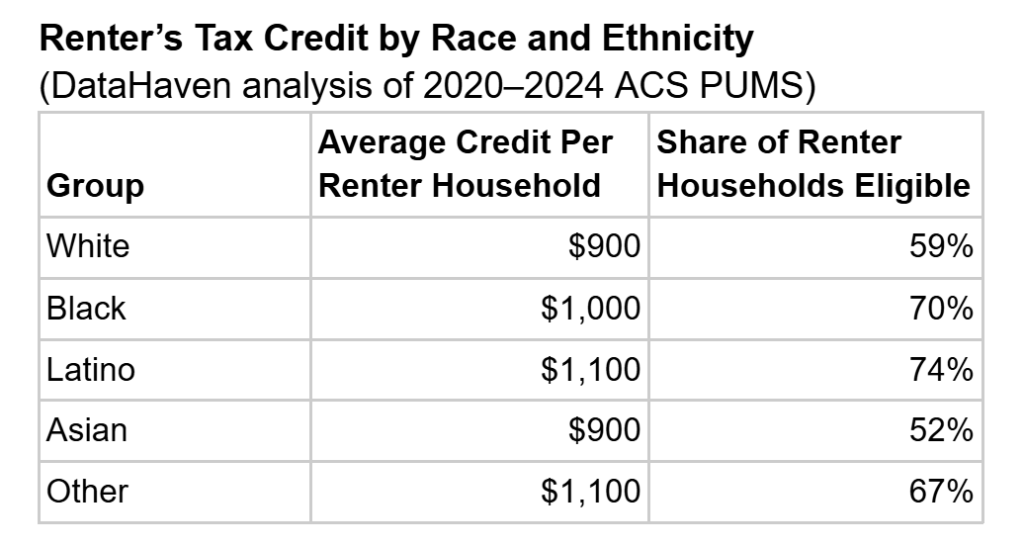
The table above shows that the proposed credit would offer larger credits to Black and Latino renters, who have significantly higher shares of housing cost burden compared to white renters. Unlike the town estimates, these numbers are based on the American Community Survey Public-Use Microdata Samples. PUMS data were needed to estimate renter credits by race and ethnicity because the ACS summary files do not include breakdowns of rents and household incomes by race and ethnicity. Renter’s tax credit estimates from ACS summary files and PUMS roughly align (see Methodology section for more information).
While our predictions show that white and Asian households would receive $900 from the credit on average, Black and Latino households would receive $1,000 and $1,100, respectively. This can be attributed to differences in shares of eligible renter households by race and ethnicity. While 59 percent and 52 percent of white and Asian renter households, respectively, would be eligible for the credit, higher shares of Black (70 percent) and Latino (74 percent) renter households would be eligible. Eligibility and credit amounts would likely vary widely within these groups; for example, as of 2023, Asian Connecticut residents who identified as Chinese were far more likely to own their homes and have an income level above the poverty line than Asian Connecticut residents who identified as Afghan, according to AAPI Data.
Conclusion
Housing costs in Connecticut have outpaced wages, particularly among renters. The state’s land-use regulations have constrained the supply of housing and contribute to an environment in which there are not enough homes to meet the state’s housing need. Although the state legislature recently passed H.B. 8002 to improve Connecticut’s housing situation, the bill does not meaningfully change the state’s municipal zoning laws. The components of the bill targeted at affordable housing creation could take many years to lower costs.
A renter’s tax credit would offer immediate relief to renter households. The credit of about $1,100 per year for the average renter household would represent a meaningful reduction in housing cost burden among lower-income renters.
Still, many lower-income renters would remain cost burdened even if this credit were implemented. The bill offers no relief to higher-income renters or homeowners, who are also impacted by recent spikes in housing costs, mortgage rates, and homeowners insurance. The state legislature should consider passing a renter’s tax credit, but should also consider additional measures to relieve housing costs, both for lower-income renters and for the many other groups impacted by the housing affordability crisis.
Methodology
To estimate the proposed renter’s tax credit for towns and legislative districts, we used Table B25122, Household Income in the Past 12 Months (in 2024 Inflation-Adjusted Dollars) by Gross Rent, from the 2020–2024 American Community Survey Summary Files. This table provides counts of households by household income and gross rent brackets. To estimate the number of eligible households in each income-rent bin, we split the data into two groups: renter households with incomes less than $75,000 and married renter households with incomes between $75,000 and $150,000. Renter households with incomes less than $75,000 were obtained directly from the ACS table. To estimate married renter households with incomes between $75,000 and $150,000, the proportion of $100,000–$150,000 renter households in the $100,000+ income bin was estimated using American Community Survey Public-Use Microdata Sample (PUMS) files. The proportion of married households among $100,000–$150,000 renter households was also estimated from PUMS. These proportions were multiplied by the number of $100,000+ renter households.
We estimated credit amounts by taking the midpoints of each income and rent bin. For example, a household in the $50,000 to $74,999 income bin spending $1,000 to $1,249 on rent was assigned an income of $62,500 and a rent of $1,125. The household income was multiplied by 90 percent to estimate the adjusted gross income. Next, 4 percent of the adjusted gross income was subtracted from 20 percent of the annual rent. This amount was capped at $2,500 to compute the credit amount per eligible household in each income-rent group. Finally, credit amounts were multiplied by the number of eligible households in each group, and these totals were added together to calculate the total credit amounts for towns and legislative districts.
Total credit amounts and counts of households were aggregated to the Five Connecticuts (CT5) level from the town level. For towns, legislative districts, and CT5 regions, average credit amount per renter household and shares of eligible households among renter households were calculated.
We used 2020–2024 ACS PUMS data to estimate the average credit amount and eligible share by race and ethnicity. For each racial and ethnic group, a sample of incomes and rents was applied to the credit amount formula described above. As with the ACS summary files, all renter households making less than $75,000 and all married renter households making $75,000–$150,000 were considered eligible.
Additional Maps