Connecticut Metro COG

Key Facts
| Title | Connecticut Metro COG 2015-2024 | Connecticut 2015-2024 |
|---|---|---|
|
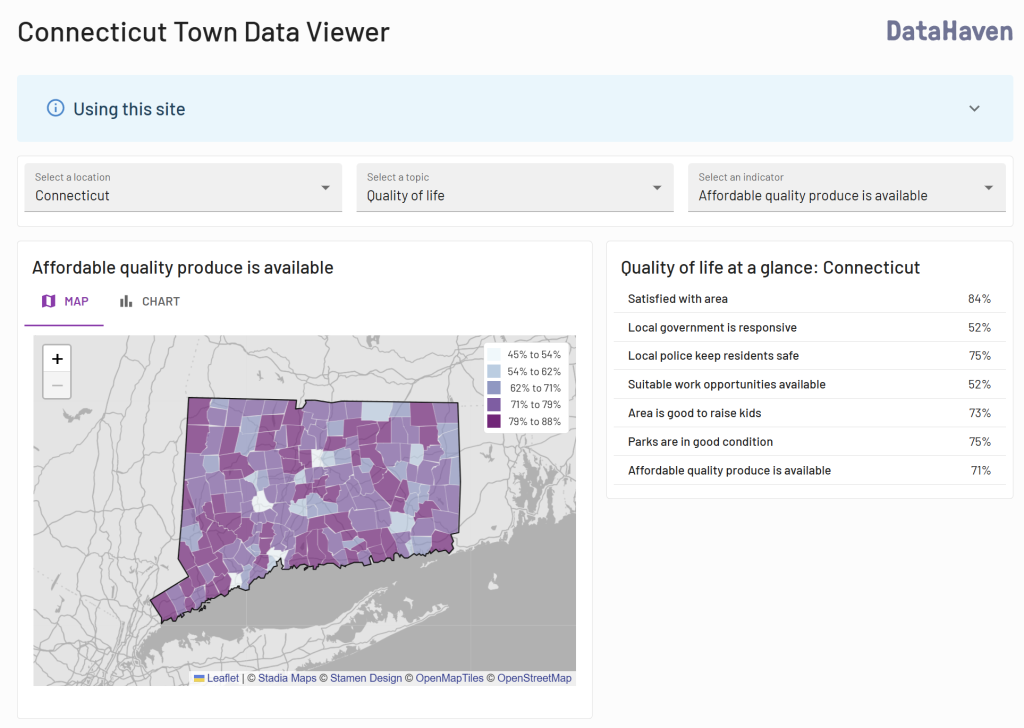
% of adults, Satisfied with area where they live
|
80%
|
84%
|
|
% of adults, Trust neighbors
|
80%
|
84%
|
|
% of adults, Area is good place to raise kids
|
61%
|
73%
|
|
% of adults, Local parks in good condition
|
72%
|
75%
|
|
% of adults, Stores, etc. in walking distance
|
64%
|
57%
|
|
% of adults, Safe places to bike
|
59%
|
65%
|
|
% of adults, Feel safe to walk at night in their neighborhood
|
63%
|
69%
|
|
% of adults, In excellent or very good health
|
55%
|
57%
|
|
% of adults, Satisfied with life
|
64%
|
66%
|
|
% of adults, Bothered by anxiety
|
14%
|
13%
|
|
% of adults, Get social / emotional support
|
65%
|
68%
|
|
Food Insecurity Rate
|
17%
|
16%
|
|
Housing Insecurity Rate
|
11%
|
10%
|
|
Transportation Insecurity Rate
|
16%
|
14%
|
|
Maximum MoE on above estimates: +/- 2% for Connecticut Metro COG; +/- 1% for CT statewide
|
||
| Title |
Connecticut Metro COG 2023 5-year |
Error |
Connecticut 2023 5-year |
Error |
|---|---|---|---|---|
|
Total Population
|
326,296
|
+/-
0
|
3,598,348
|
+/-
0
|
|
Population Ages 0-17
|
72,652
|
+/-
1,116
|
733,998
|
+/-
4,336
|
|
% of Total Population, Ages 0-17
|
22%
|
+/-
0%
|
20%
|
+/-
0%
|
|
Population Ages 65+
|
51,467
|
+/-
1,407
|
650,772
|
+/-
5,064
|
|
% of Total Population, Ages 65+
|
16%
|
+/-
0%
|
18%
|
+/-
0%
|
|
Population Female
|
166,267
|
+/-
110
|
1,833,231
|
+/-
367
|
|
% of Total Population, Female
|
51%
|
+/-
0%
|
51%
|
+/-
0%
|
| Title |
Connecticut Metro COG 2023 5-year |
Error |
Connecticut 2023 5-year |
Error |
|---|---|---|---|---|
|
Latino Population
|
85,034
|
+/-
0
|
640,668
|
+/-
0
|
|
% of Total Population, Latino
|
26%
|
+/-
0%
|
18%
|
+/-
0%
|
|
White Non-Hispanic Population
|
174,303
|
+/-
1,257
|
2,265,780
|
+/-
3,030
|
|
% of Total Population, White Non-Hispanic
|
53%
|
+/-
0%
|
63%
|
+/-
0%
|
|
Black Non-Hispanic Population
|
36,215
|
+/-
685
|
355,413
|
+/-
2,943
|
|
% of Total Population, Black Non-Hispanic
|
11%
|
+/-
0%
|
10%
|
+/-
0%
|
|
Other Race Non-Hispanic Population
|
30,744
|
+/-
1,524
|
336,487
|
+/-
4,560
|
|
% of Total Population, Other Race Non-Hispanic
|
9%
|
+/-
0%
|
9%
|
+/-
0%
|
| Title |
Connecticut Metro COG 2023 5-year |
Error |
Connecticut 2023 5-year |
Error |
|---|---|---|---|---|
|
Foreign-born Population
|
73,230
|
+/-
2,710
|
555,161
|
+/-
8,104
|
|
% of Total Population, Foreign-born
|
22%
|
+/-
1%
|
15%
|
+/-
0%
|
| Title |
Connecticut Metro COG 2023 5-year |
Error |
Connecticut 2023 5-year |
Error |
|---|---|---|---|---|
|
Total Households
|
118,335
|
+/-
749
|
1,420,170
|
+/-
3,490
|
|
Owner-Occupied Households
|
77,362
|
+/-
1,297
|
939,912
|
+/-
5,867
|
|
Homeownership Rate
|
65%
|
+/-
1%
|
66%
|
+/-
0%
|
|
Cost-Burdened Households
|
47,181
|
+/-
1,840
|
479,072
|
+/-
5,993
|
|
% of Households, Cost-Burdened
|
41%
|
+/-
1%
|
35%
|
+/-
0%
|
|
Households with a car
|
105,592
|
+/-
2,472
|
1,298,057
|
+/-
7,878
|
|
% of Households, with a car
|
89%
|
+/-
2%
|
91%
|
+/-
0%
|
| Title |
Connecticut Metro COG 2023 5-year |
Error |
Connecticut 2023 5-year |
Error |
|---|---|---|---|---|
|
Population Ages 25+
|
220,459
|
+/-
54
|
2,532,853
|
+/-
342
|
|
Ages 25+ without a high school diploma
|
28,095
|
+/-
1,443
|
219,549
|
+/-
4,597
|
|
% of Population Ages 25+, without a high school diploma
|
13%
|
+/-
1%
|
9%
|
+/-
0%
|
|
Ages 25+ with a Bachelor's degree or more
|
91,838
|
+/-
2,246
|
1,062,403
|
+/-
8,599
|
|
% of Population Ages 25+, with a Bachelor's degree or more
|
42%
|
+/-
1%
|
42%
|
+/-
0%
|
| Title |
Connecticut Metro COG 2023 5-year |
Error |
Connecticut 2023 5-year |
Error |
|---|---|---|---|---|
|
Median Household Income
|
87,135
|
+/-
1,961
|
93,760
|
+/-
669
|
| Title |
Connecticut Metro COG 2023 5-year |
Error |
Connecticut 2023 5-year |
Error |
|---|---|---|---|---|
|
Total Population, Poverty Status Determined
|
318,192
|
+/-
5,024
|
3,510,193
|
+/-
17,103
|
|
Population in Poverty
|
42,096
|
+/-
2,654
|
351,948
|
+/-
8,796
|
|
Poverty Rate
|
13%
|
+/-
1%
|
10%
|
+/-
0%
|
|
Population Low-Income
|
84,501
|
+/-
3,940
|
775,737
|
+/-
13,220
|
|
Low-Income Rate
|
27%
|
+/-
1%
|
22%
|
+/-
0%
|
| Title |
Connecticut Metro COG 2023 5-year |
Error |
Connecticut 2023 5-year |
Error |
|---|---|---|---|---|
|
Population Ages 0-17, Poverty Status Determined
|
71,851
|
+/-
2,600
|
724,622
|
+/-
8,134
|
|
Population Ages 0-17 In Poverty
|
12,811
|
+/-
1,235
|
95,177
|
+/-
3,539
|
|
Population Ages 0-17, Poverty Rate
|
18%
|
+/-
2%
|
13%
|
+/-
0%
|
|
Population Ages 0-17 Low-Income
|
24,061
|
+/-
1,662
|
204,747
|
+/-
5,137
|
|
Population Ages 0-17, Low-Income Rate
|
33%
|
+/-
2%
|
28%
|
+/-
1%
|
| Title |
Connecticut Metro COG 2023 5-year |
Error |
Connecticut 2023 5-year |
Error |
|---|---|---|---|---|
|
Population Ages 65+, Poverty Status Determined
|
50,445
|
+/-
1,699
|
633,062
|
+/-
5,939
|
|
Population Ages 65+ In Poverty
|
5,543
|
+/-
650
|
52,355
|
+/-
1,898
|
|
Population Ages 65+ Poverty Rate
|
11%
|
+/-
1%
|
8%
|
+/-
0%
|
|
Population Ages 65+ Low-Income
|
12,969
|
+/-
981
|
139,185
|
+/-
3,268
|
|
Population Ages 65+, Low-Income Rate
|
26%
|
+/-
2%
|
22%
|
+/-
0%
|
Source
Community Well-being data are from the 2015-2024 DataHaven Community Wellbeing Survey. See definitions below for more information. All other data are from the US Census Bureau ACS 5-year estimate. The ACS surveys a sample of households on a rolling monthly basis; survey data are aggregated and averaged into 1 and 5-year period estimates. The Census Bureau considers the 5-year estimates to be the most accurate and recommends using 5-year estimates for town-level data.