Connecticut Town Equity Reports
Reports featuring disaggregated local data on well-being and equity for all 169 CT towns
Access the reports for all 169 Connecticut towns
The current reports on this website represent version 3.0, and were published in December 2025 for all Connecticut towns.
Town-level data may also be viewed and downloaded in our Connecticut Town Data Viewer.
About the Reports
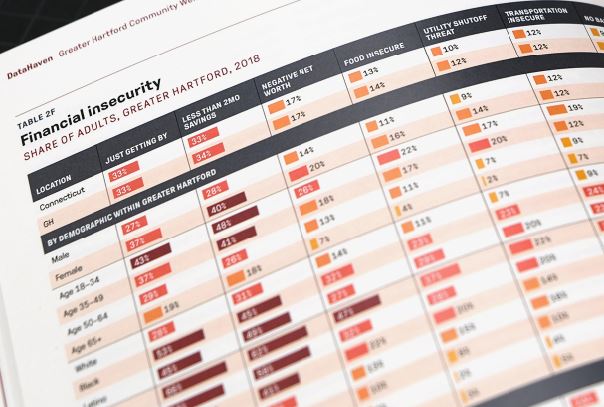
The DataHaven Town Equity Reports disaggregate data from the 2020 Census, American Community Survey microdata files, DataHaven Community Wellbeing Survey record-level files, and federal and state agencies to create relevant town-level information that is not available from any other source. These innovative and user-friendly reports are informing many local- and state-level efforts to improve community well-being.
DataHaven has published reports for each of the 169 towns in Connecticut. Additionally, DataHaven has created reports for state agency service areas, counties, Councils of Governments (Census County Equivalent Entities), and many other areas, based on groupings of towns. Graphics from each individual report are available on request. Please contact DataHaven with suggestions for the next edition.
Reports for geographic regions
Reports for many larger geographic areas based on groupings of towns, such as DMHAS Regions, Councils of Governments (COG) service areas, hospital service areas, or custom-defined areas, may be found on the reports section of our website, or by request. These reports are designed to correspond with the town-level reports. Please contact us to learn more.
Data User Guides
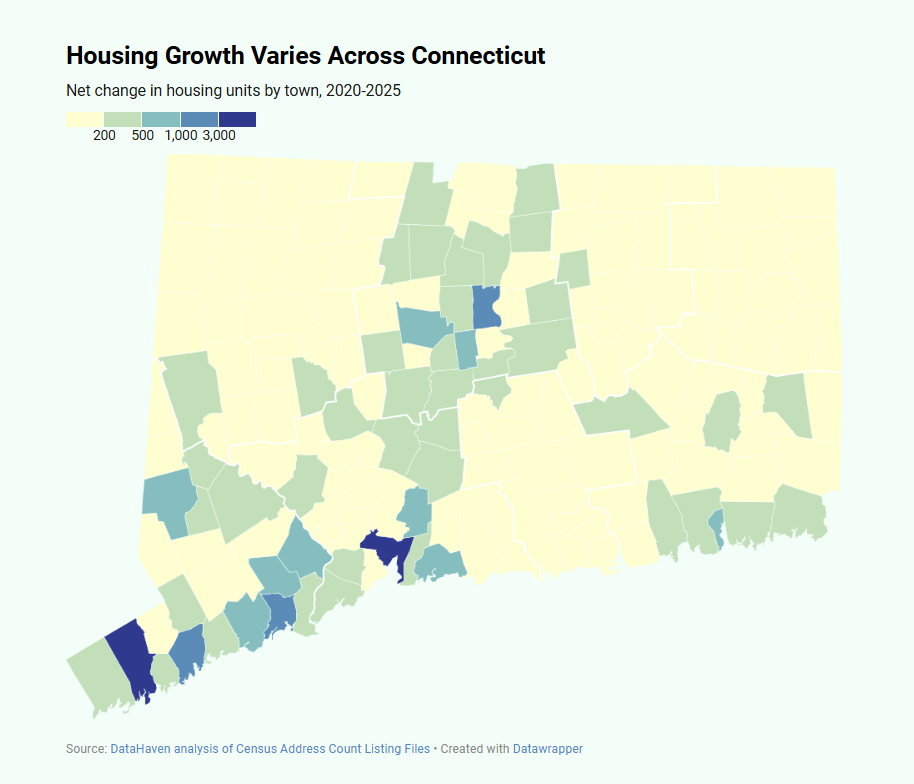
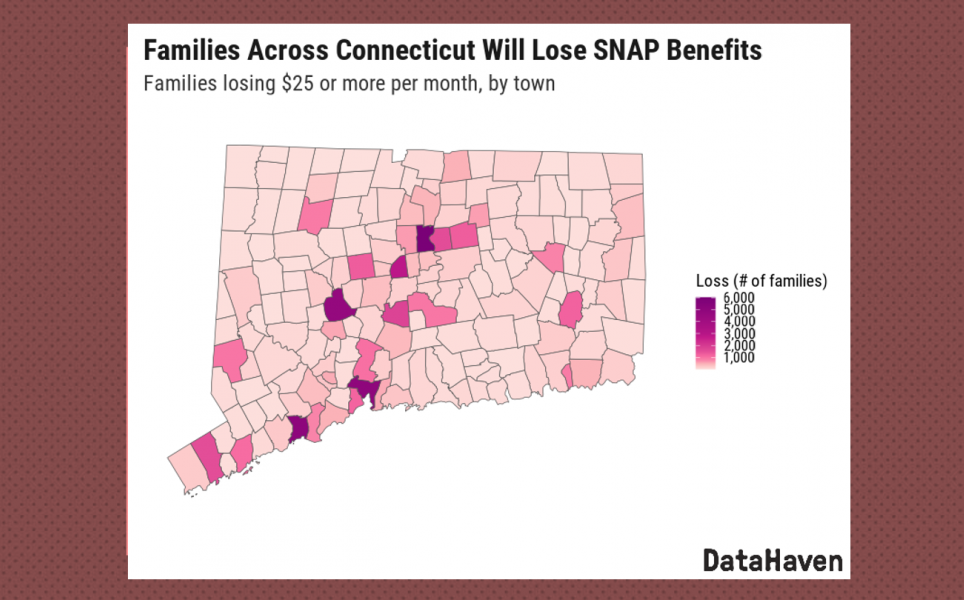
A more thorough narrative discussion of the issues covered in the Town Equity Reports may be found in our Community Index reports and our statewide health equity report. Sources used are cited in the appendix of each report. Indicators in the 2025 report include population change, demographics (age, race/ethnicity, immigration, language spoken and linguistic isolation), homeownership and tenure (owners and renters), income, housing cost burden, poverty, SNAP (food stamps), vehicle ownership, student test scores and graduation rate, school discipline (suspensions), adult education level attainment, K-12 student enrollment demographics, assisted housing units, overcrowding, jobs and wages, unemployment, median household income, home broadband internet, health insurance coverage, dental visits, preventive care, exercise, food insecurity, self-rated health, smoking, diabetes, hypertension (high blood pressure), asthma, anxiety, depression, drug overdose, fentanyl, HIV, PrEP usage, birth outcomes (prenatal care, low birthweight, infant mortality), lead poisoning, satisfaction with area, trust in neighbors, child-friendliness, public safety, safety walking at night, government responsiveness, voting and civic engagement, environmental indicators (including hazardous waste), walking and biking, tree canopy cover and impervious surfaces.
Acknowledgements
For 2025 reports (version 3.0): The 2025 Connecticut Town Equity Reports build on work originally supported in 2020 by generous grants from the Emily Hall Tremaine Foundation (tremainefoundation.org). Its current publication was made possible through support from the Greater Hartford Gives Foundation, The Community Foundation for Greater New Haven, The Connecticut Project, and individual donors. The report also benefited from in-kind contributions and guidance from local organizations and residents across Connecticut. One of the principal data sources used in this report, the DataHaven Community Wellbeing Survey (DCWS), is sustained by more than 80 public and private funders across Connecticut. Lead sponsors of the 2024 and 2025 DCWS included Connecticut Children’s, Connecticut Community Foundation, Connecticut Health Foundation, Fairfield County’s Community Foundation, Hartford Department of Health and Human Services, Greater Hartford Gives Foundation, Hartford HealthCare, Health Improvement Alliance (Greater Bridgeport), Naugatuck Valley Health District, New Haven Health Department, Nuvance Health, Stamford Health, Stamford Department of Health and Human Services, The Community Foundation for Greater New Haven, The Connecticut Project, Trinity Health of New England, United Way of Central and Northeastern Connecticut, United Way of Connecticut, United Way of Greater New Haven, University of Hartford, Yale Cancer Center, Yale-New Haven Health, and Yale University. The report also relies on statistical information produced by many state and federal agencies. We are grateful for their ongoing commitment to transparent, reliable public data that informs community work across Connecticut.
Acknowledgements for versions 1.0 and 2.0 of the reports may be found within the report files themselves. Version 1.0 was released in 2021. Version 2.0 was released in 2023. Typically these older editions can be found by searching our website or visiting the town Community Profile pages.
Suggested Citations
For 2025 reports: Seaberry, C., Davila, K., Abraham, M. (2025). [Town] Equity Report. New Haven, CT: DataHaven. Published December 2025. More information at ctdatahaven.org.
Report document notes, clarifications, and errata
- In the education section of version 1.0 of the reports (2021 versions), suspension rates are described as suspensions per 1,000 students. To clarify, this indicator is actually based on the number of students suspended at least once per 1,000 students. If a student has more than one suspension in a year, they only count towards this rate once.
- In the education section of a draft of version 2.0 of the reports (2023 draft versions), the document endnote for the SBAC ELA pass rate in Figure 8 did not fully describe the source used, and the methodology for creating estimates for the ELA pass rate for small groups needed to be modified to improve precision. We addressed both of these issues in the final versions of version 2.0 of the reports, posted on the website.