Browse Data By
This series of tables shows how redistricting has affected population counts in the census. Areas of analysis are New Haven, the inner ring suburbs, the outer ring suburbs, and the Valley region.
The Analysis of Impediments is part of the requirements for the city of New Haven to receive HUD program funds. It prevents discrimination and promotes fair housing choices by analyzing any factors that may restrict housing choice based on race, religion, sex, disability, familial status, or national origin.
The State of Connecticut applied for the “Communities Putting Prevention to Work” grant from the U.S. Department of Health and Human Services. The grant is intended to address obesity, physical inactivity, poor nutrition, and tobacco use/exposure. New Haven would be the state’s partner in the project.
These tables show how the populations of Connecticut’s largest cities and towns have changed between the 2000 census and the 2010 census. The cities and towns are ranked based on population, and the table shows overall population counts as well as demographic breakdowns.
This is a PDF version of the report. Please see the main report page for more information.
DataHaven has maintained neighborhood and community profiles and maps for over 30 years. The Connecticut Town Data Viewer includes estimates for all 169 towns Connecticut towns, COG regions, and the state as a whole on topics such as quality of life, financial security, neighborhood assets, health, income, housing, and demographics.
View the 2024 Connecticut Town Data Viewer by clicking here.
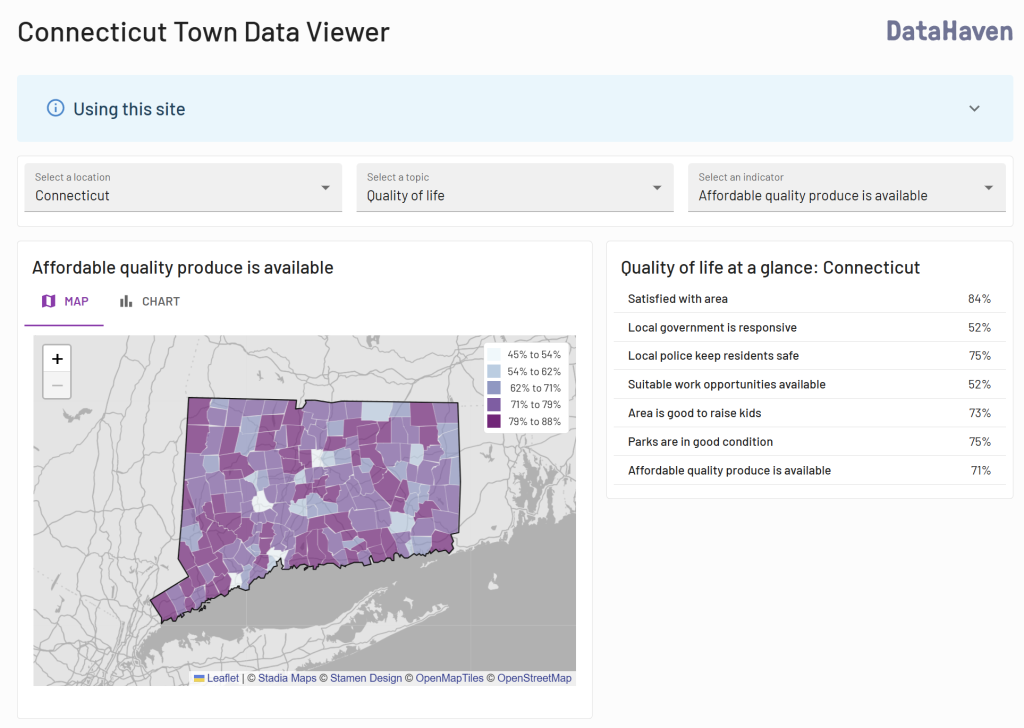
Click the map or use the dropdown menus to select your town and topic of interest. After viewing the visualization, click on the “X” in the top right to return to this page.
Links to download the raw data are embedded within the visualization itself (see links at bottom). Please contact us if you have any issues accessing these data files.
More information
Please contact us with any questions. Data for other Connecticut communities, towns, and areas are posted on our community profile page, in our Town Equity Reports, and elsewhere on this website.
This is a PDF version of the report. Please see the main report page for more information.
Middlesex Health conducts a community health needs assessment (CHNA) every three years in order to provide a comprehensive overview of the health and well-being of the community we serve. While the Internal Revenue Code 501(r), as set forth by the Patient Protection and Affordable Care Act, requires not-for-profit hospitals to perform a CHNA every three taxable years, the intent for our CHNA is to provide a systematic, data-driven approach that serves as a useful tool for prioritizing health and well-being needs not only for Middlesex Health but for our community partners.
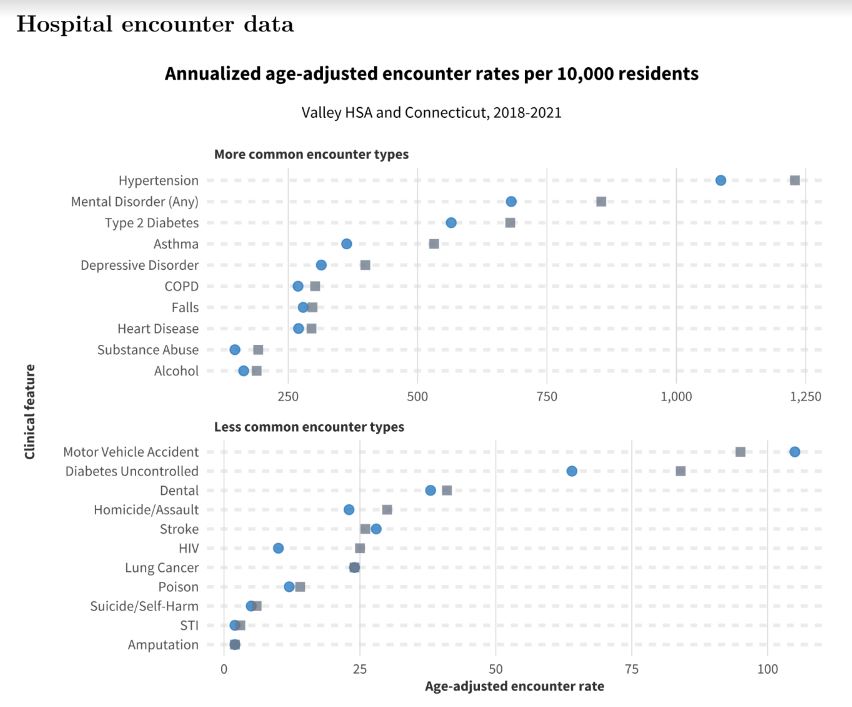
This report includes primary and secondary quantitative data sources of key health and well-being indicators, benchmarked against the state of Connecticut whenever possible. Primary data were collected and analyzed through the DataHaven 2024 Community Wellbeing Survey and the DataHaven 2024 Community-Based Assets and Needs Survey. Secondary data were collected from a variety of publicly available sources and the Connecticut Hospital Association ChimeData study.
In this community health needs assessment (CHNA), “Middlesex Health Service Area” includes the 15 towns in Middlesex County (Chester, Clinton, Cromwell, Deep River, Durham, East Haddam, East Hampton, Essex, Haddam, Killingworth, Middlefield, Middletown, Old Saybrook, Portland, and Westbrook) and the four towns on the periphery of Middlesex County (Colchester, Lyme, Marlborough, Old Lyme) for the visualizations for the DataHaven Community Wellbeing Survey, DataHaven Community-Based Assets and Needs Survey and the Connecticut Hospital Association ChimeData study.