All DataHaven Programs, Civic Vitality, Community Wellbeing Survey, Demographics, Economy, Education, Health, Housing, Public Safety
More than 4 in 5 CT adults satisfied where they live, but town-by-town breakdown reveals divide
[Excerpt of feature article in Hearst CT newspapers, August 2, 2023, by Alex Putterman]
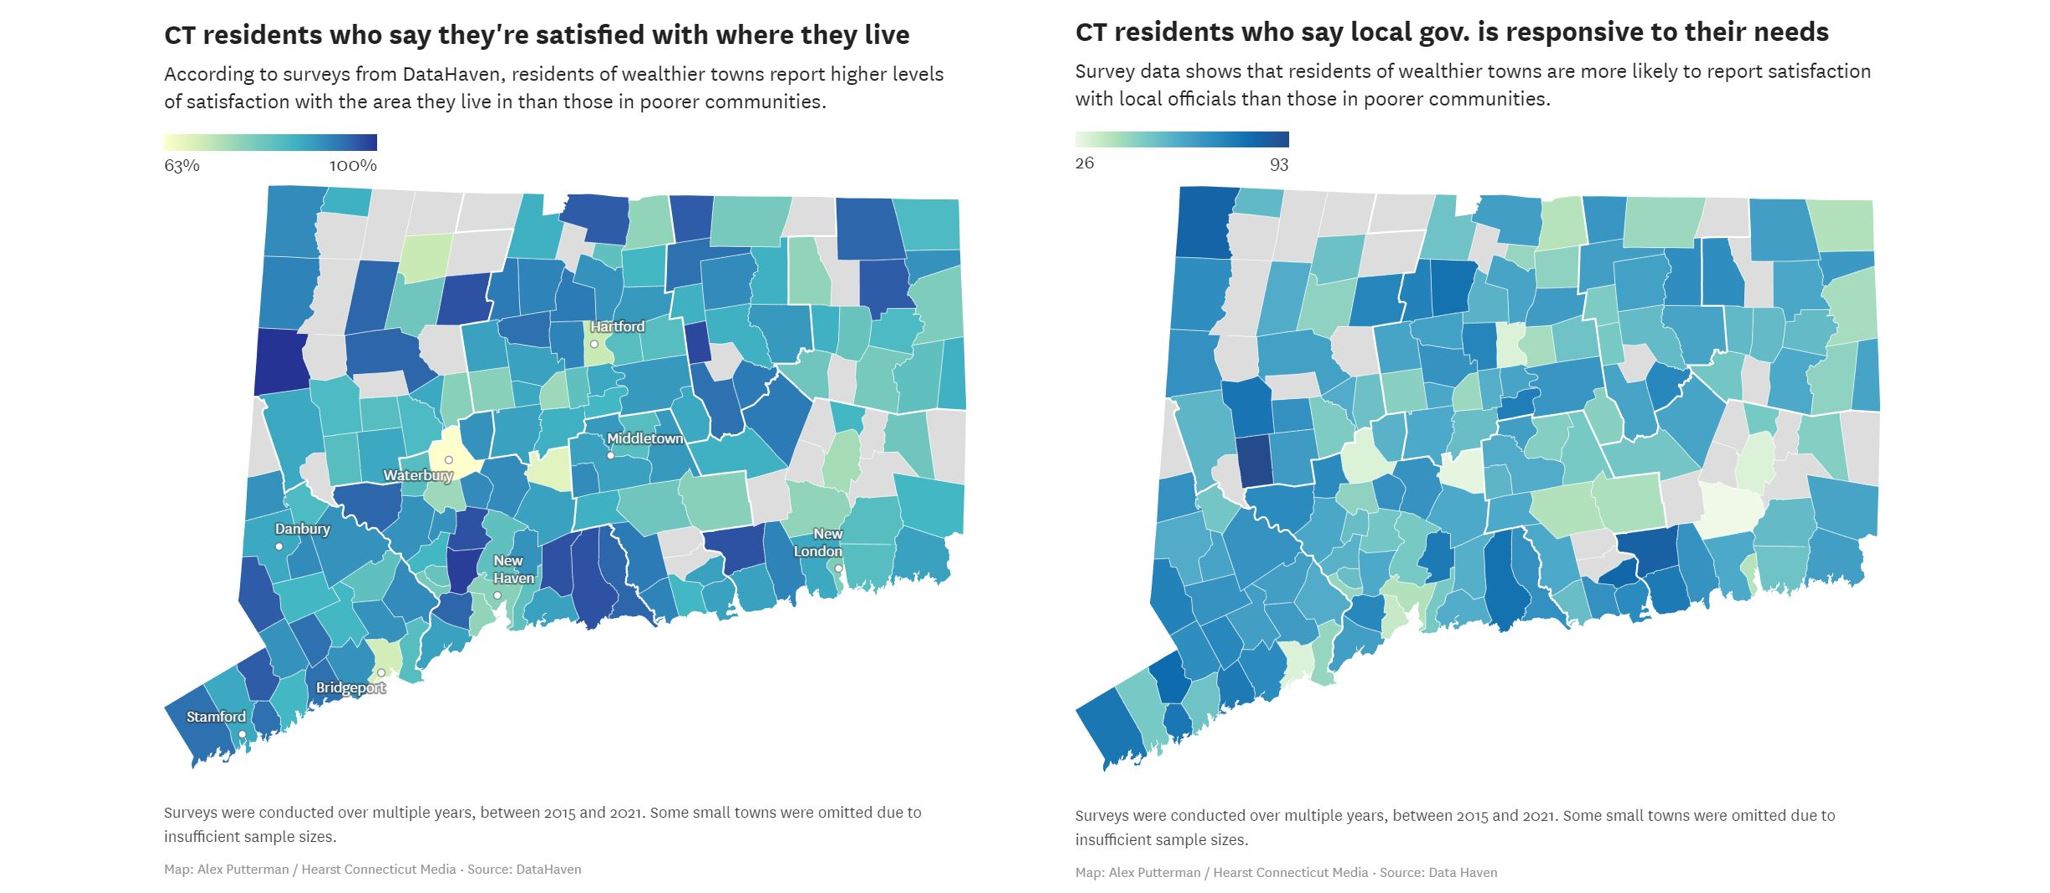
More than 4 in 5 Connecticut adults are satisfied with where they live, new data shows — but the positive vibes aren’t distributed evenly across the state.
In a series of surveys conducted by the non-profit DataHaven over a multi-year period, residents of Connecticut’s wealthier communities were far more likely to report satisfaction with the area they live in than those in poorer communities. Among all towns, Kent, Woodbridge and Bolton had the highest rate of residents who were satisfied with their areas, while Waterbury, Meriden and Bridgeport had the lowest.
[….]
Meanwhile, adults in Roxbury, Lyme and Salisbury were most likely to say local government was responsive to residents’ needs, while Montville, Meriden, Waterbury, Bridgeport, Hartford and Norwich residents were the least likely to say the same.
In terms of both satisfaction with where people live as well as approval of local government, responses correlated with income levels, with people in wealthier towns more inclined to respond positively.
Overall, 84 percent of Connecticut adults said they’re satisfied with the area they live, while 53 percent said their local government was responsive to their needs.
This data comes from a new set of “equity reports” released by DataHaven this week, which feature information on race, income, housing, employment and more for all 169 of Connecticut’s town and cities, as well as the broader regions they belong to. Many of the figures come from DataHaven surveys conducted between 2015 and 2021, while others are aggregated from the U.S. Census and other sources.
Overall, the DataHaven reports depict a state sharply divided by race and class, with Black and Latino residents far more likely to face poverty, housing insecurity, health risks and more.
DataHaven works closely with local communities and collects information on well-being, equity, and quality of life across Connecticut.
Here are some key takeaways about life in Connecticut, as reflected in the DataHaven reports.
Housing insecurity high in CT cities
As part of its equity reports, DataHaven tracked the share of households in each towns or city that are “cost-burdened,” meaning they spend at least 30 percent of their total income on housing.
In major cities, the numbers were jarring. In Hartford, 54 percent of households are cost-burdened. In New Haven, it’s 52 percent. In Bridgeport, 49 percent.
In Greenwich, by comparison, 34 percent of households are cost-burdened.
When it comes to homeownership, the results were nearly inverse. Only 26 percent of households in Hartford and 28 percent in New Haven own their homes, as compared to 88 percent in Westport and 97 percent in Weston. Homeownership rates were also below 50 percent in other populous cities, including Bridgeport, Stamford and Waterbury. [….]
The problems are worst for Black and Latino residents
In terms of housing and numerous other measures, the data shows clearly that Black and Latino people face disproportionate challenges, sometimes to extreme degrees.
Statewide, Black and Latino residents have far lower levels of homeownership than white and Asian ones and are far more likely to be cost-burdened, the data shows. They also have lower incomes, higher poverty rates and worse health.
Additionally, Black and Latino students were less likely to pass standardized tests and graduate school and far more likely to be suspended than their white and Asian counterparts.
These trends are often most pronounced in wealthier regions, such as western Connecticut, where the median household income of white residents is approximately twice that of Black and Latino residents and white students are more than twice as likely as Black and Latino students to pass standardized tests.
Income has risen in some places but fallen in others
What do Greenwich, Stamford, New Haven, Fairfield and West Hartford have in common? Median household income there increased between 2000 and 2021, when adjusted for inflation, according to DataHaven.
What do Bridgeport, Danbury, Waterbury, Hartford, Norwalk, New Britain and East Hartford have in common? Median household income there decreased during the same period, when adjusted for inflation.
Overall, Connecticut’s inflation-adjusted median household income from 2020-21 was down slightly, DataHaven found. Generally, income was more likely to rise in wealthier parts of the state and more likely to fall in poorer areas, though there were notable exceptions such as New Haven (up 5 percent) and Newtown (down 5.7 percent).
DataHaven warns that median household income figures are only estimates and often have significant margins of error.
Even in a small state, no two places are the same
Mark Abraham, DataHaven’s executive director, said his chief takeaway from the new equity reports is that Connecticut is diverse and heterogeneous, with each town and region having distinct characteristics.
“When we look at these reports, one thing they really highlight is the state is not as homogenous as so many people think,” Abraham said. “A lot of times with statewide reporting or just what you hear at the capitol, there are commonalities across communities, like urban communities are struggling with poverty. And there are some things that are definitely consistent across the state, but there are also big differences that you notice with these town-by-town reports.”
As an example, Abraham noted that Latino groups in some cities are significantly different than those in other cities, in a way that would be difficult to notice if looking at a broad overview.
Abraham said he hopes local and state officials will use the town-by-town data to shape conversations and eventually policy.
“Just having everyone be on a common ground in terms of the objective information that’s out there about different communities … in the town can be really helpful for thinking about how towns work on a day-to-day basis,” he said.

