By Kelly Davila, Coral Wonderly, and Mark Abraham
Scroll down to view maps and charts.
2020 Census data highlight growth across nearly all Bridgeport neighborhoods
Over the last ten years, Bridgeport and its neighborhoods have seen changes in population size, housing availability, and ethnic and racial makeup.
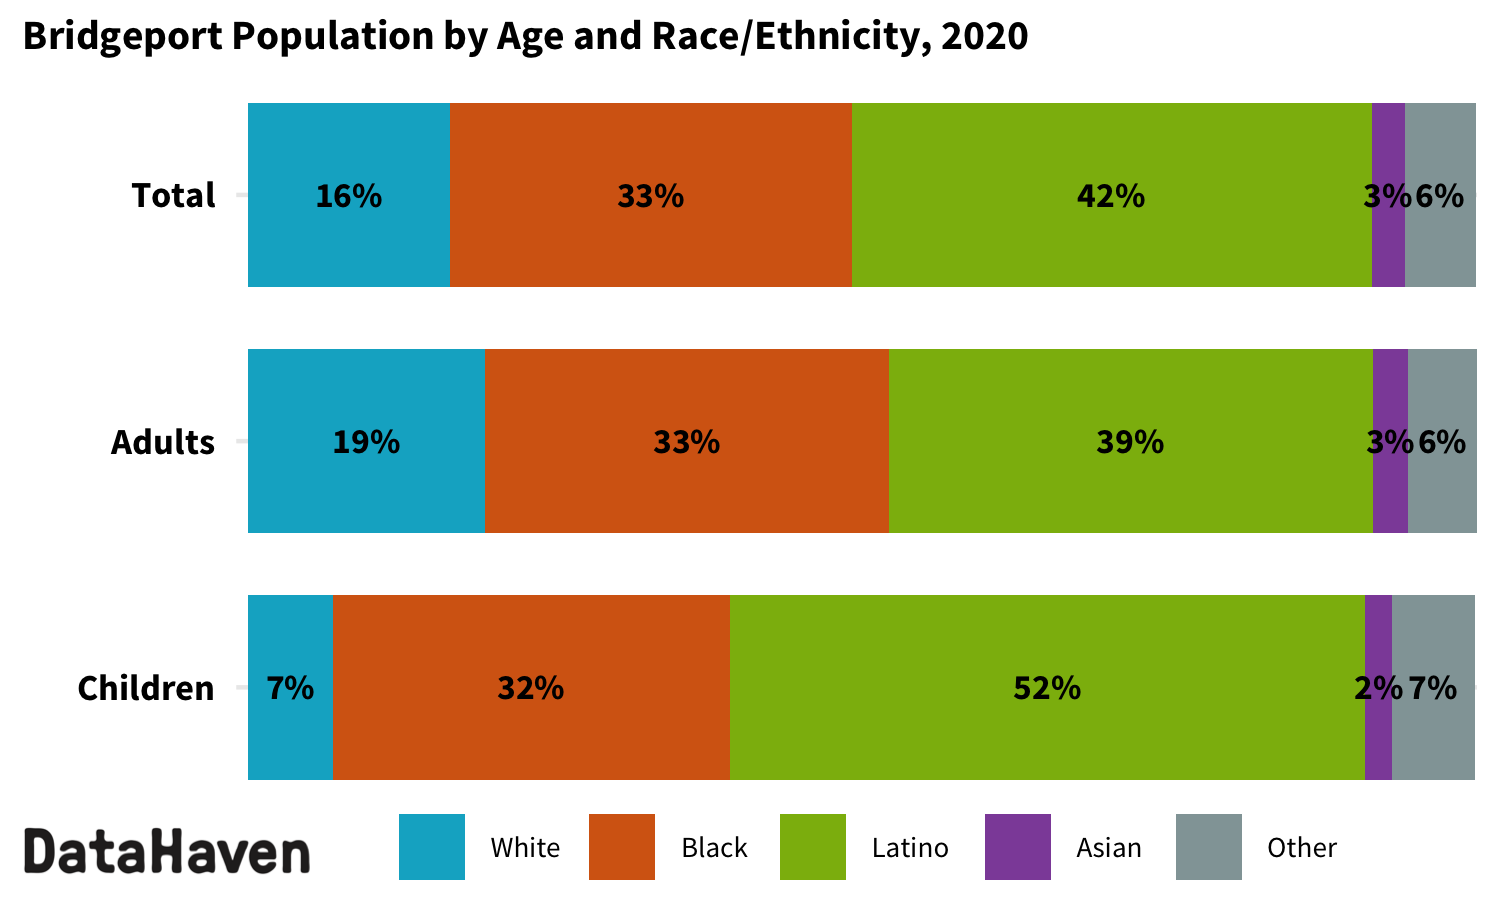
Between 2010 and 2020, the population of Bridgeport increased by 4,425 to 148,654 (a 3 percent increase, compared to the 1 percent increase statewide), part of a trend in which the populations of most of Connecticut’s larger towns increased more quickly than that of the state as a whole. The adult population rose by 5,534 to 113,716 (a 5 percent increase, compared to the 4 percent increase statewide), and the child population declined by 1,109 to 34,938 (a 3 percent decrease, compared to the 10 percent decrease statewide).
The newly released 2020 decennial census data allows for the most accurate analysis of neighborhood-level demographic changes and trends since the last census in 2010.
Changing racial/ethnic composition
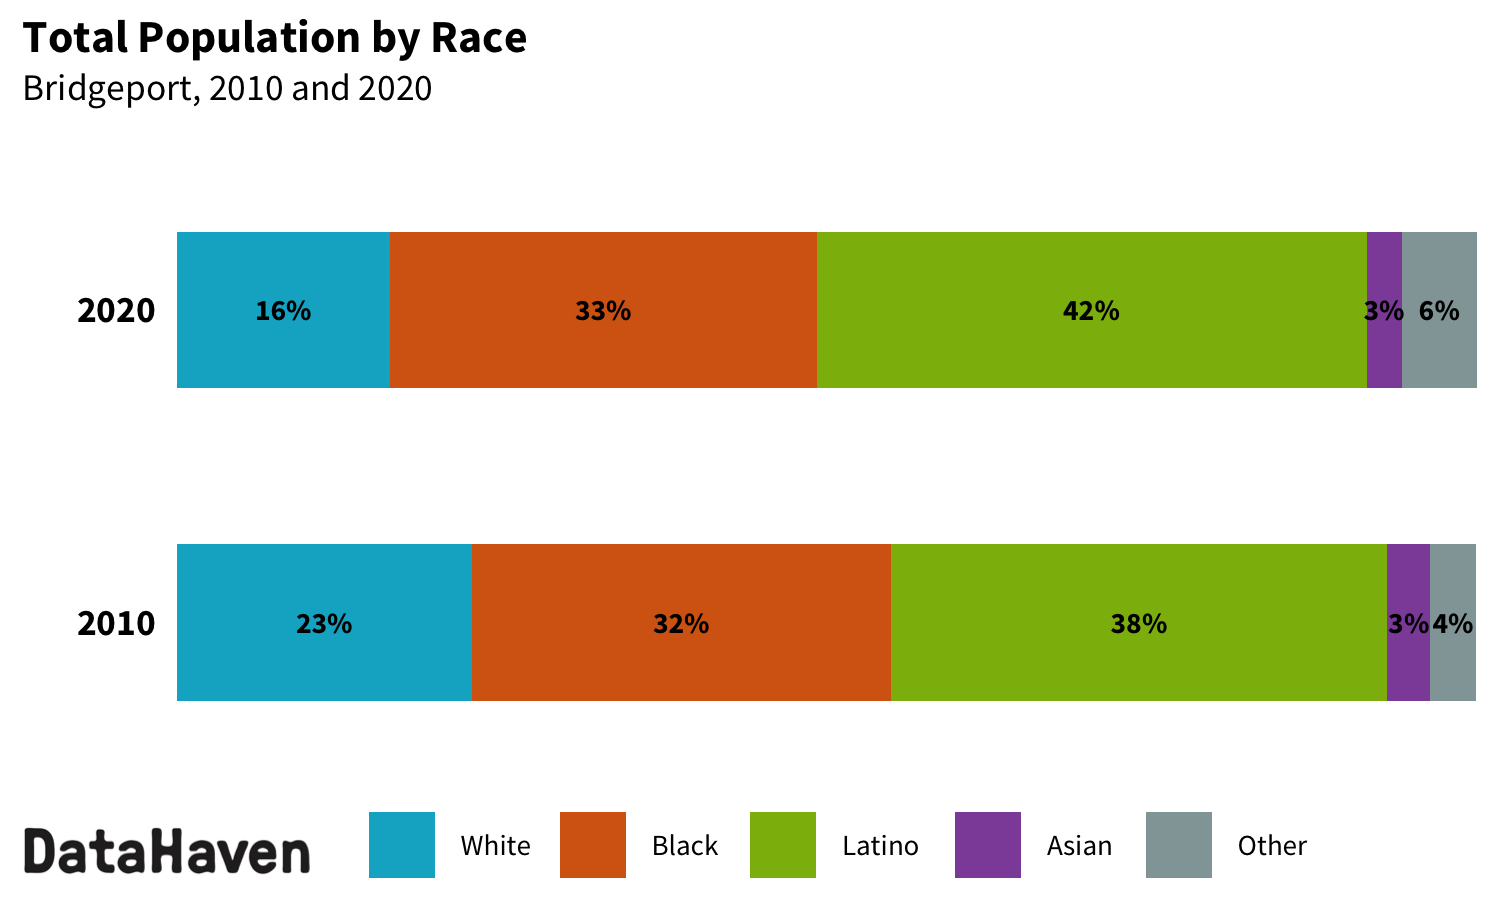
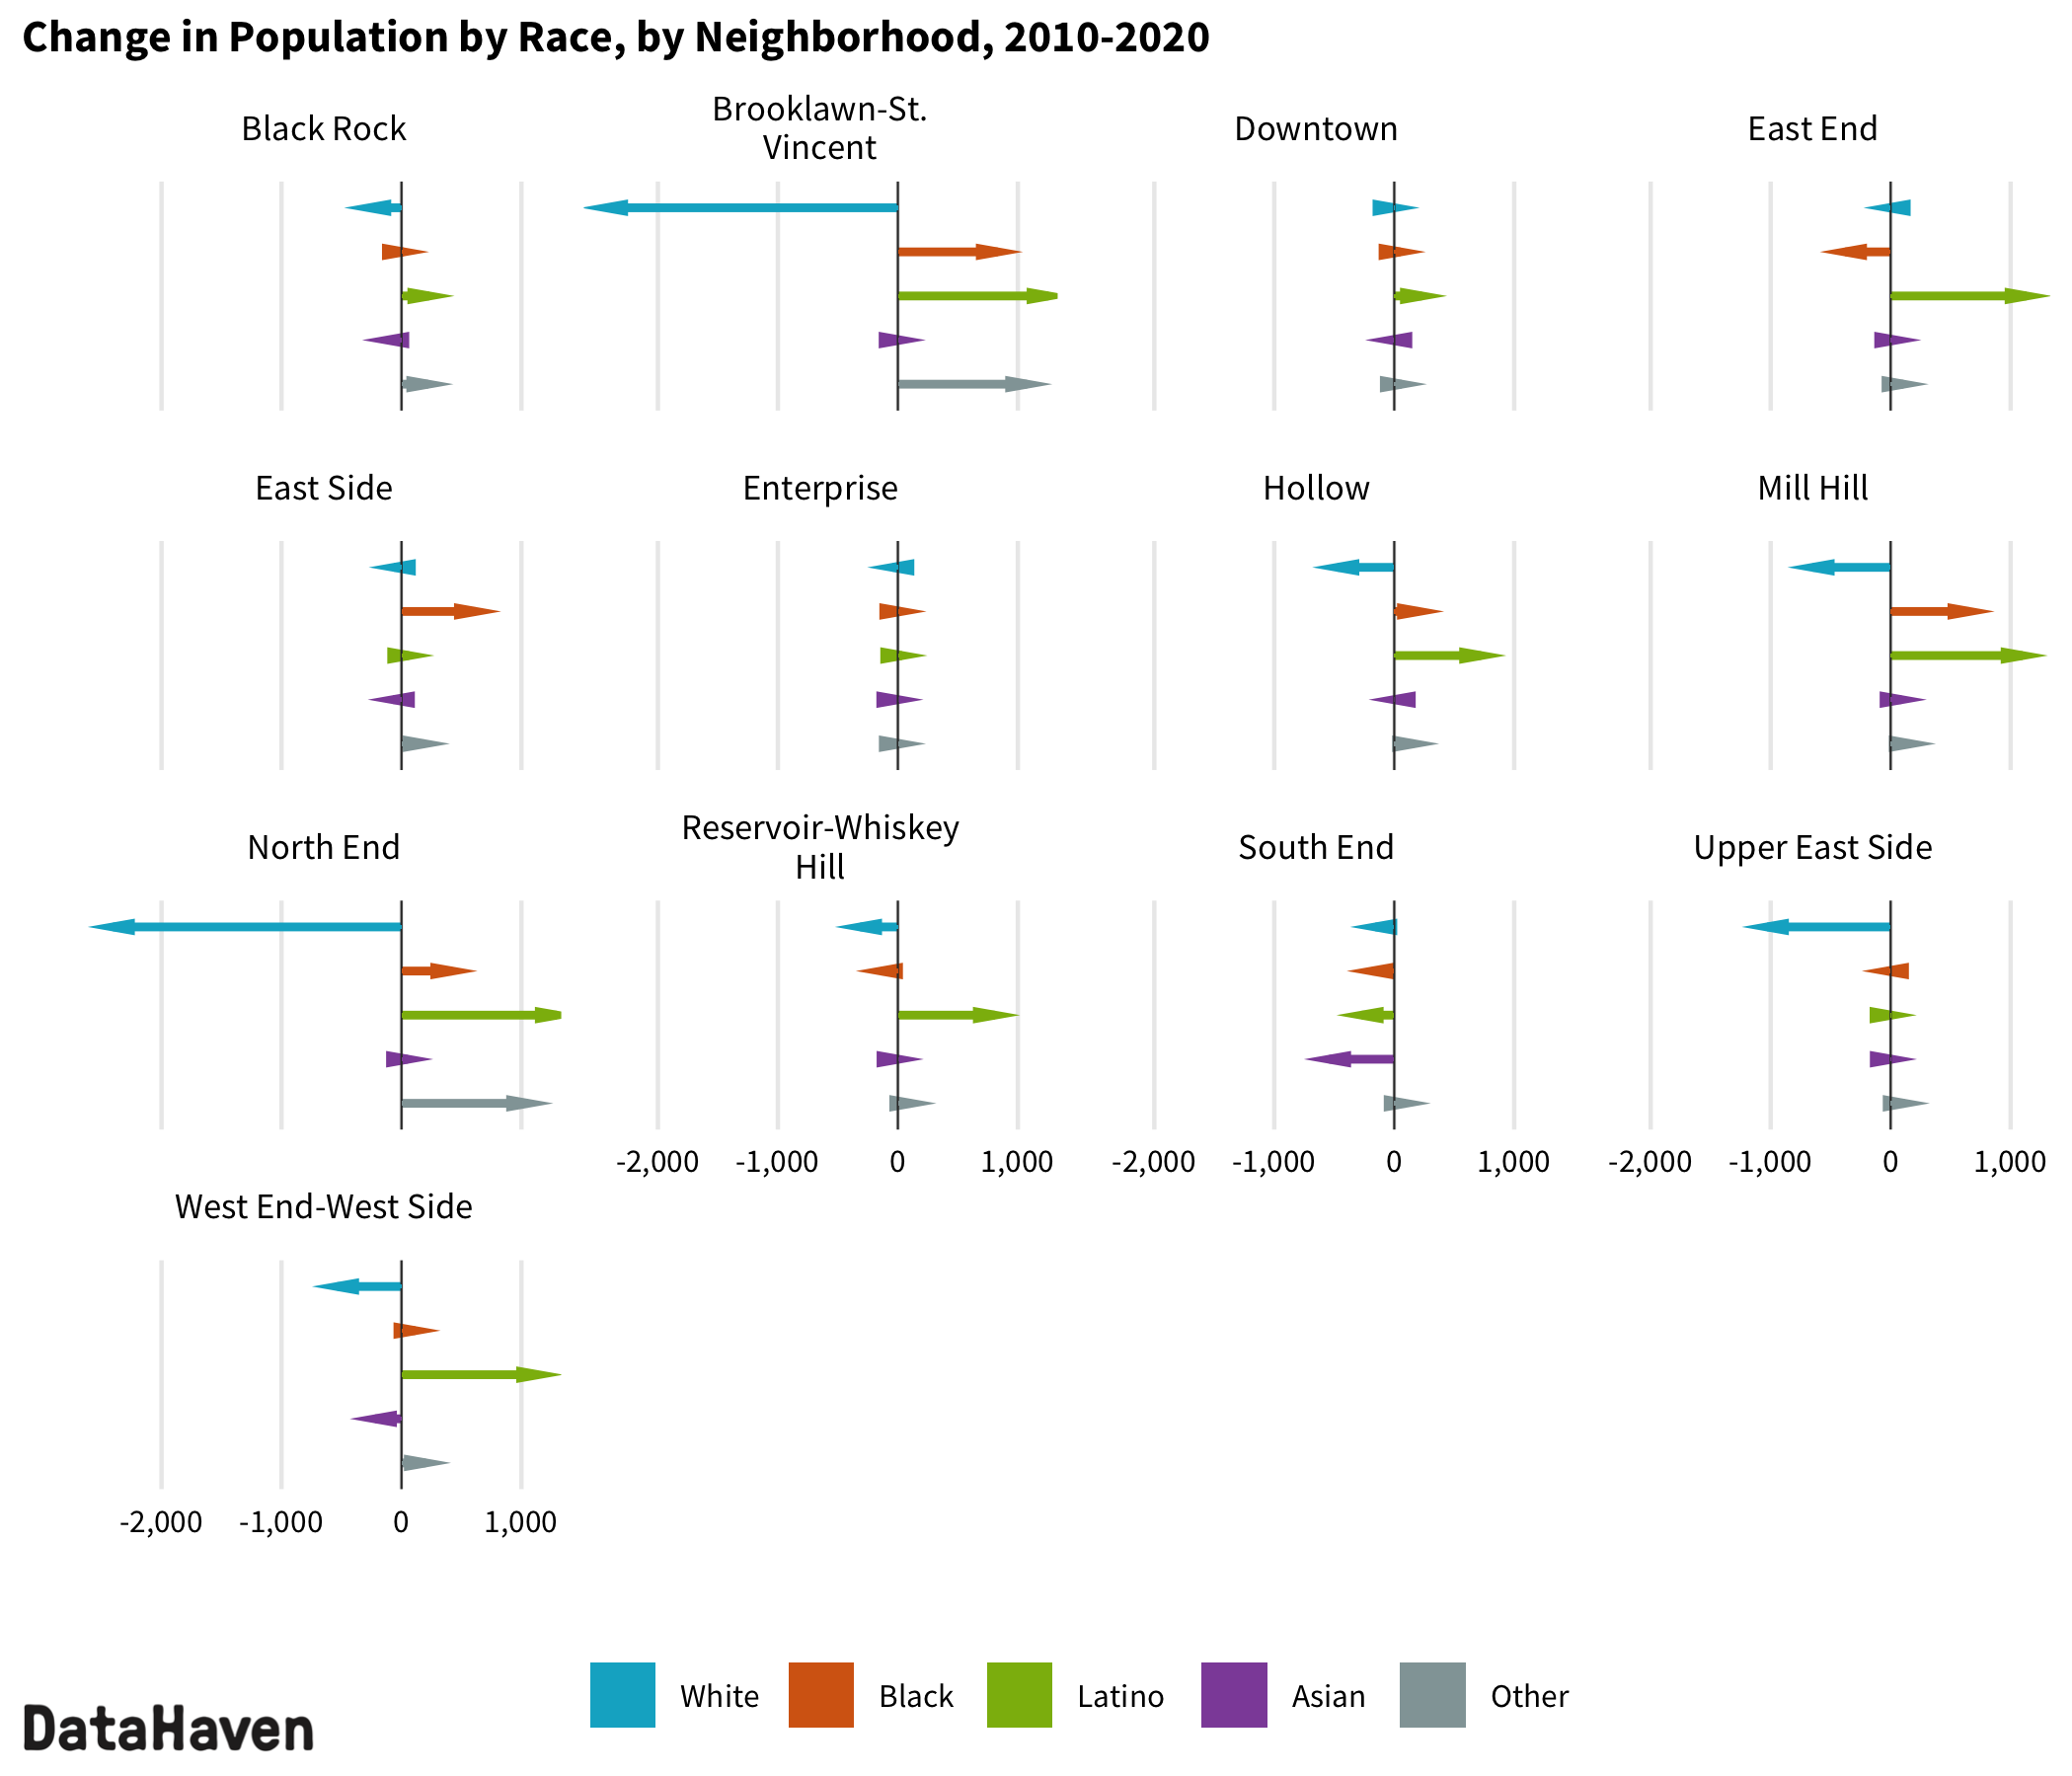
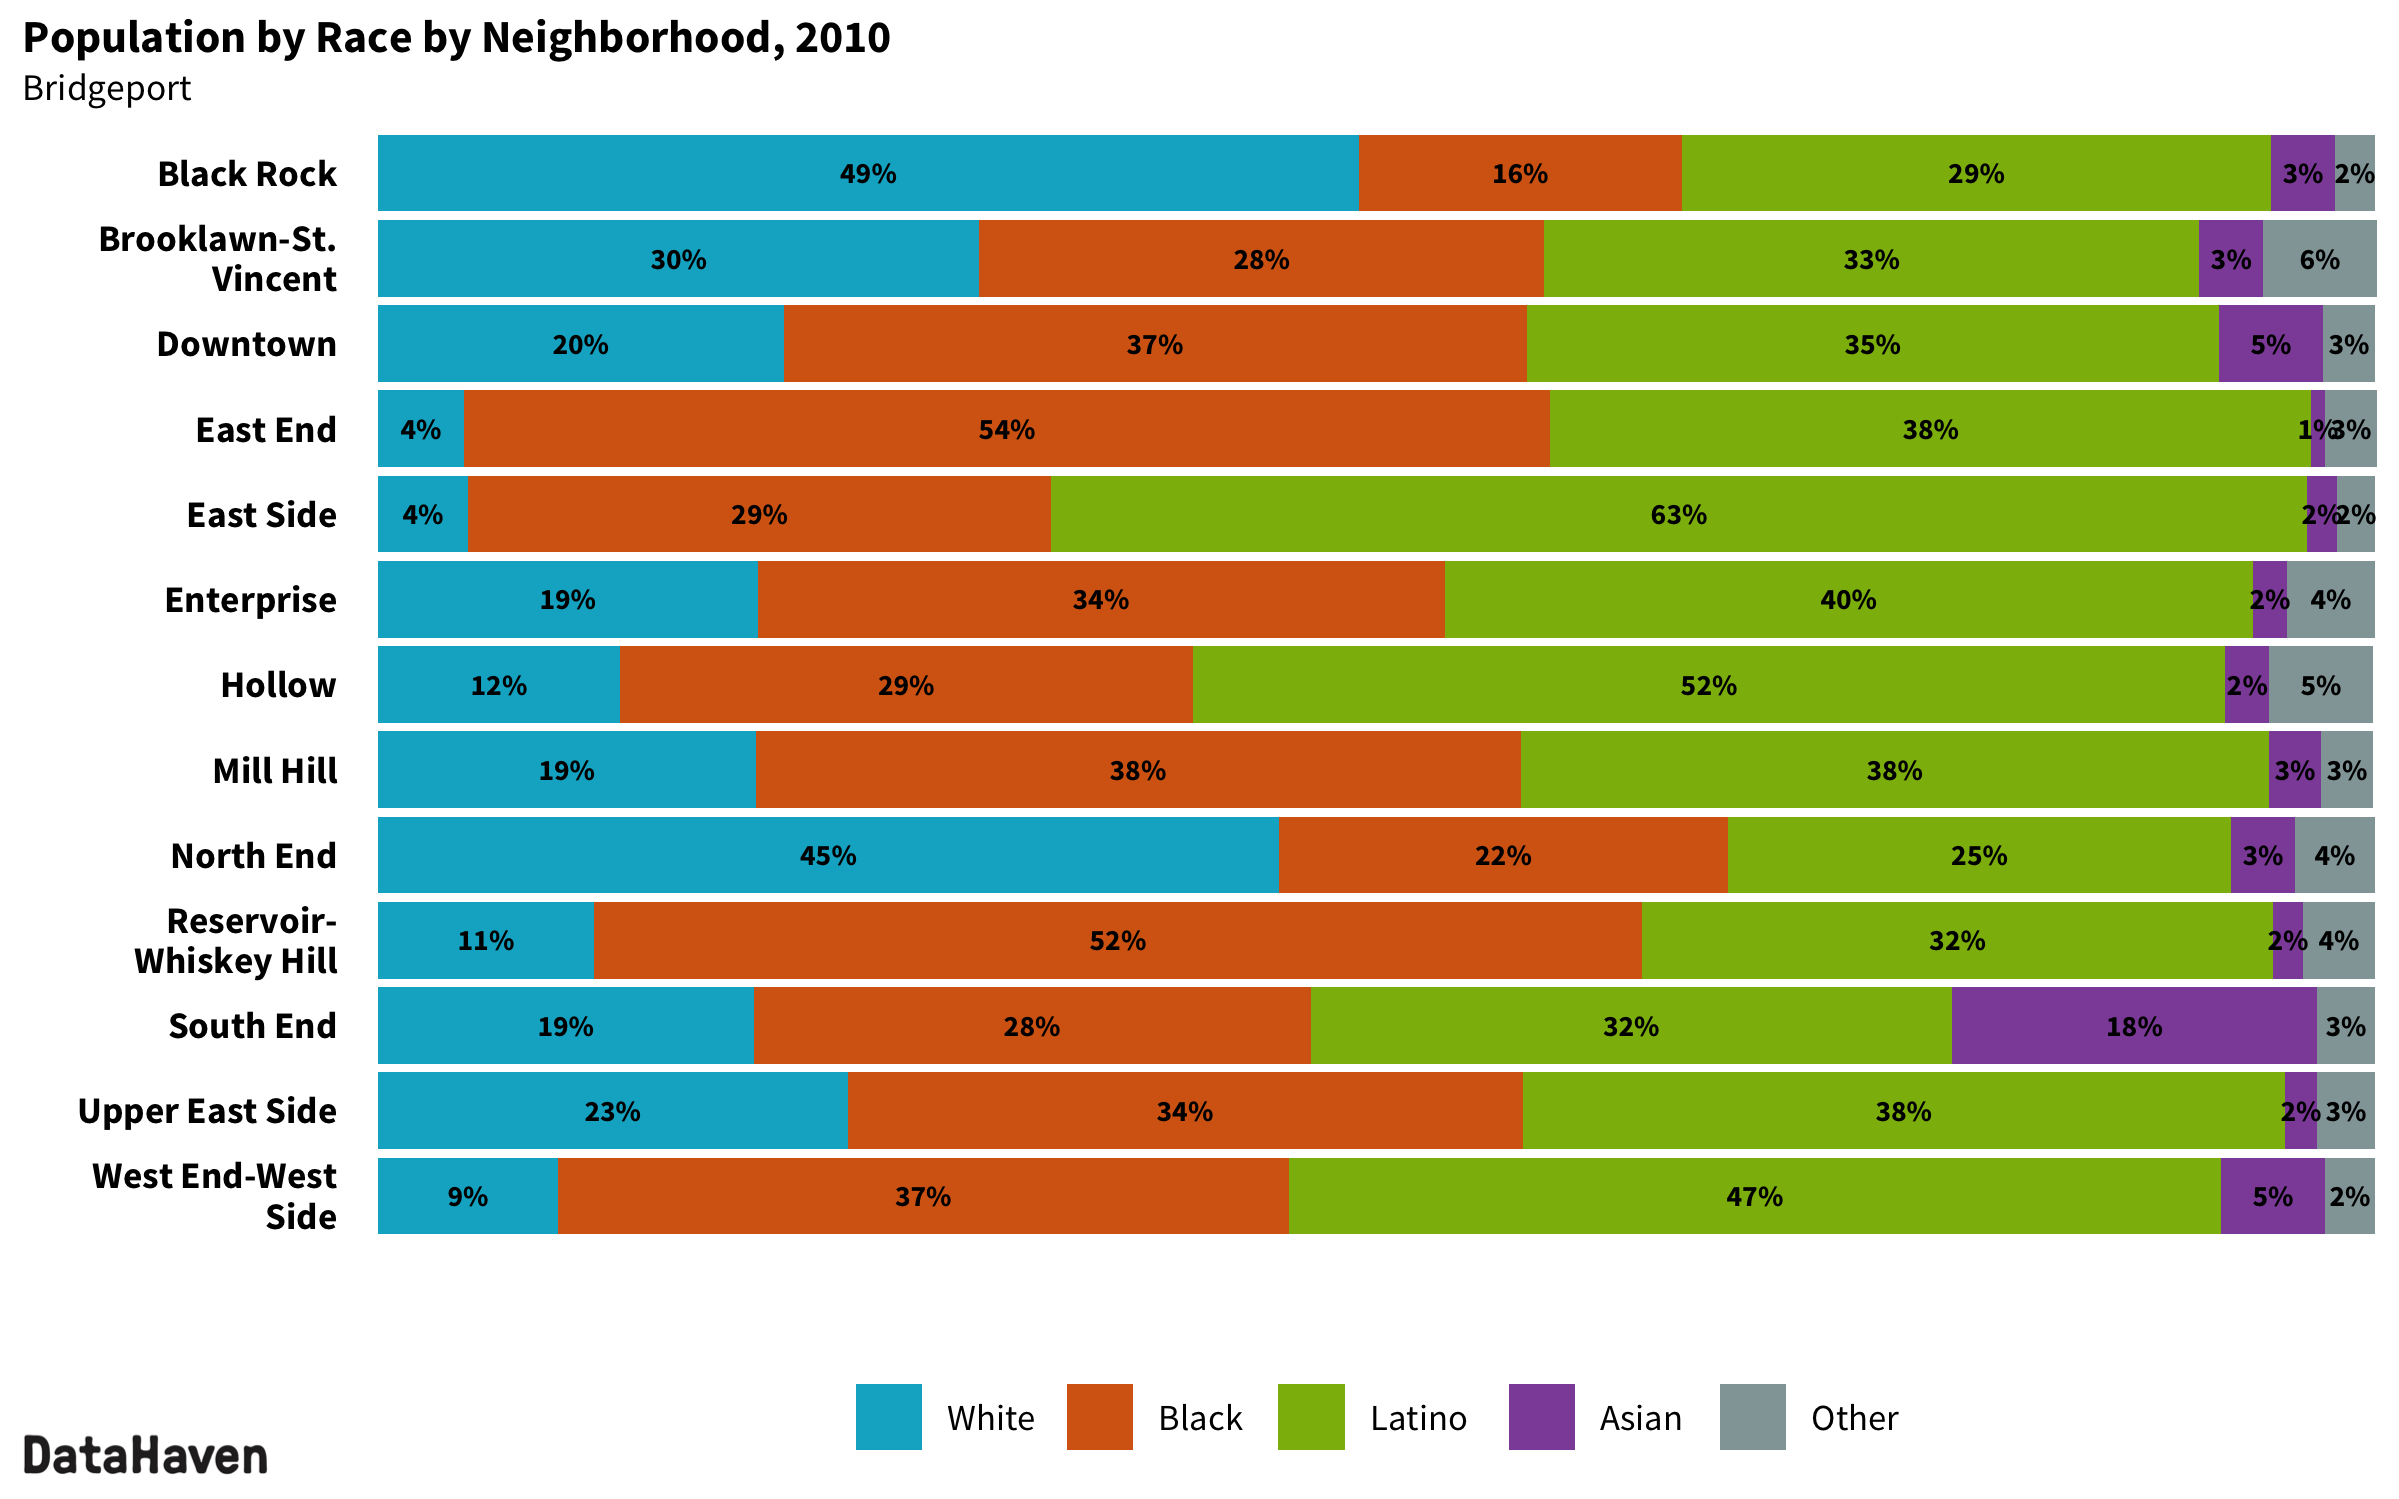
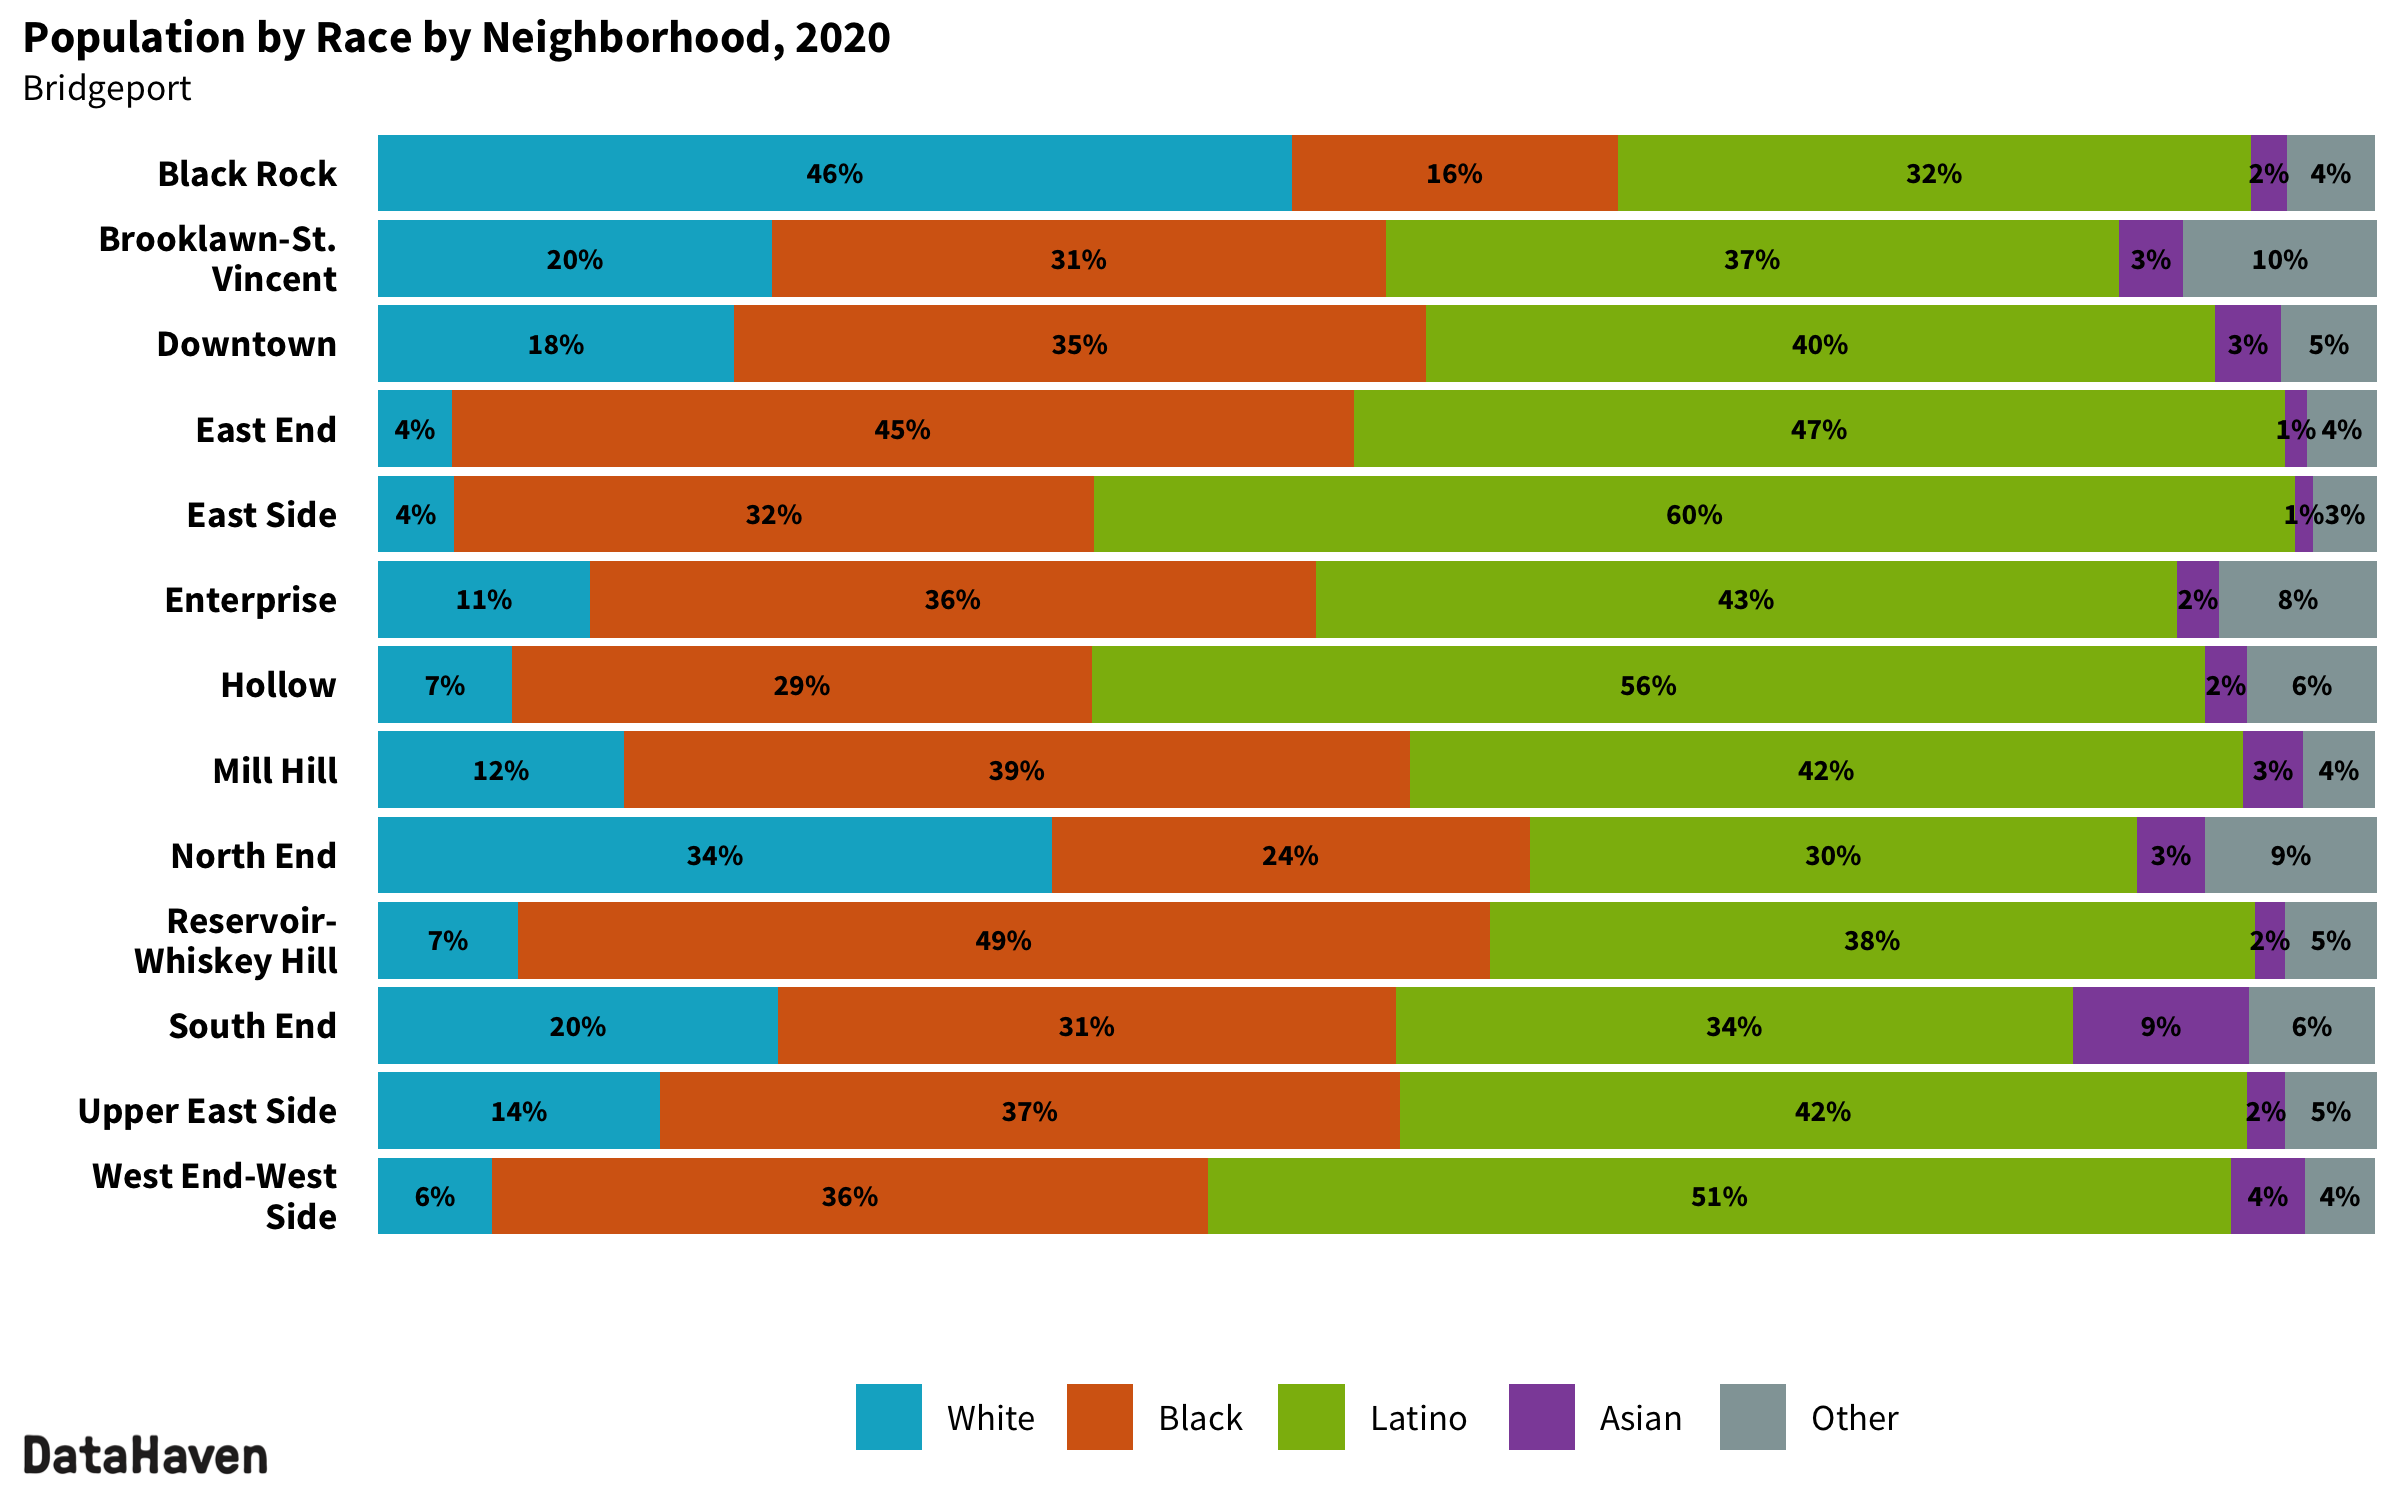
The Latino population not only continued to be the largest ethnic group in Bridgeport but also saw an increase of 7,753 residents (14 percent). It now makes up 42 percent of the city’s total population, up from 38 percent in 2010. Neighborhoods where the Latino population experienced the most change were Brooklawn-St. Vincent, East End, Mill Hill, North End, and the West End-West Side. Each of these neighborhoods experienced a gain of at least 1,000 Latino residents.
The Black population of Bridgeport increased by 2,218 individuals (5 percent) and now makes up 33 percent of the population, up from 32 percent in 2010. Neighborhoods where the Black population experienced the most changes were Brooklawn-St. Vincent, East Side, and Mill Hill. Each of these neighborhoods experienced a gain of at least 500 Black residents.
The white population of Bridgeport decreased by 8,390 residents (26 percent) and now makes up 16 percent of the population, down from 23 percent in 2010. Neighborhoods where the white population experienced the most change were Brooklawn-St. Vincent, Upper East Side, and North End. Each of these neighborhoods experienced a loss of at least 1,000 white residents.
Neighborhood population and housing trends
The 3 percent increase in the population of Connecticut’s most populous city followed the statewide trend in which the 10 largest cities collectively gained 37,109 residents while the remaining 159 towns collectively lost 5,262 residents. However, the change in population did not evenly affect all of Bridgeport’s neighborhoods.
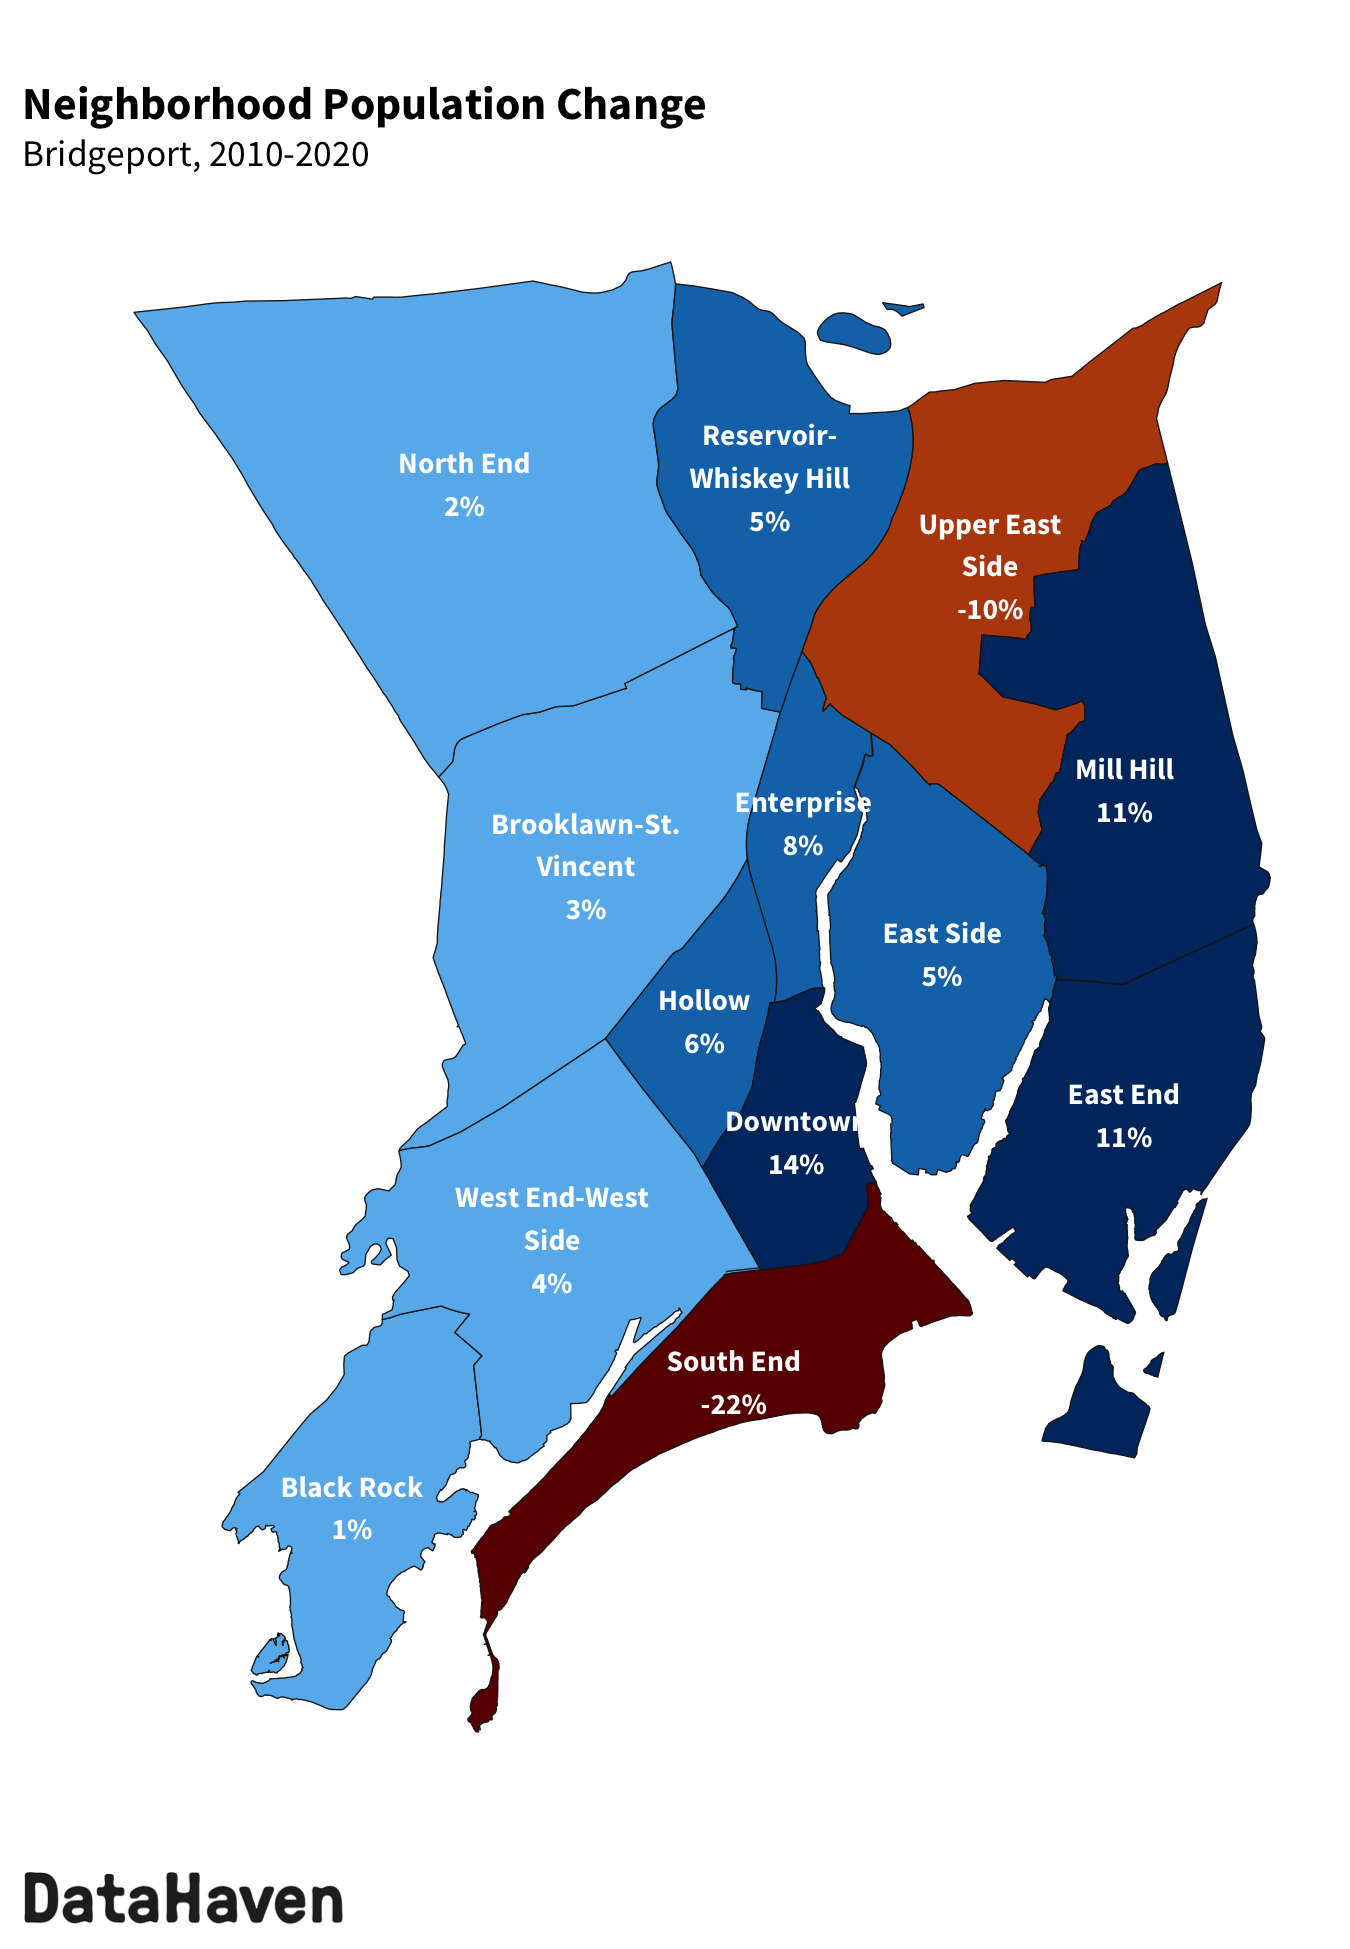
Mill Hill had the largest increase in population, gaining 1,365 new residents (11 percent). Downtown experienced the largest relative growth, increasing by 14 percent.
However, the Upper East Side and South End lost residents. The population of the Upper East Side decreased by 10 percent, and the South End population shrunk by 22 percent.
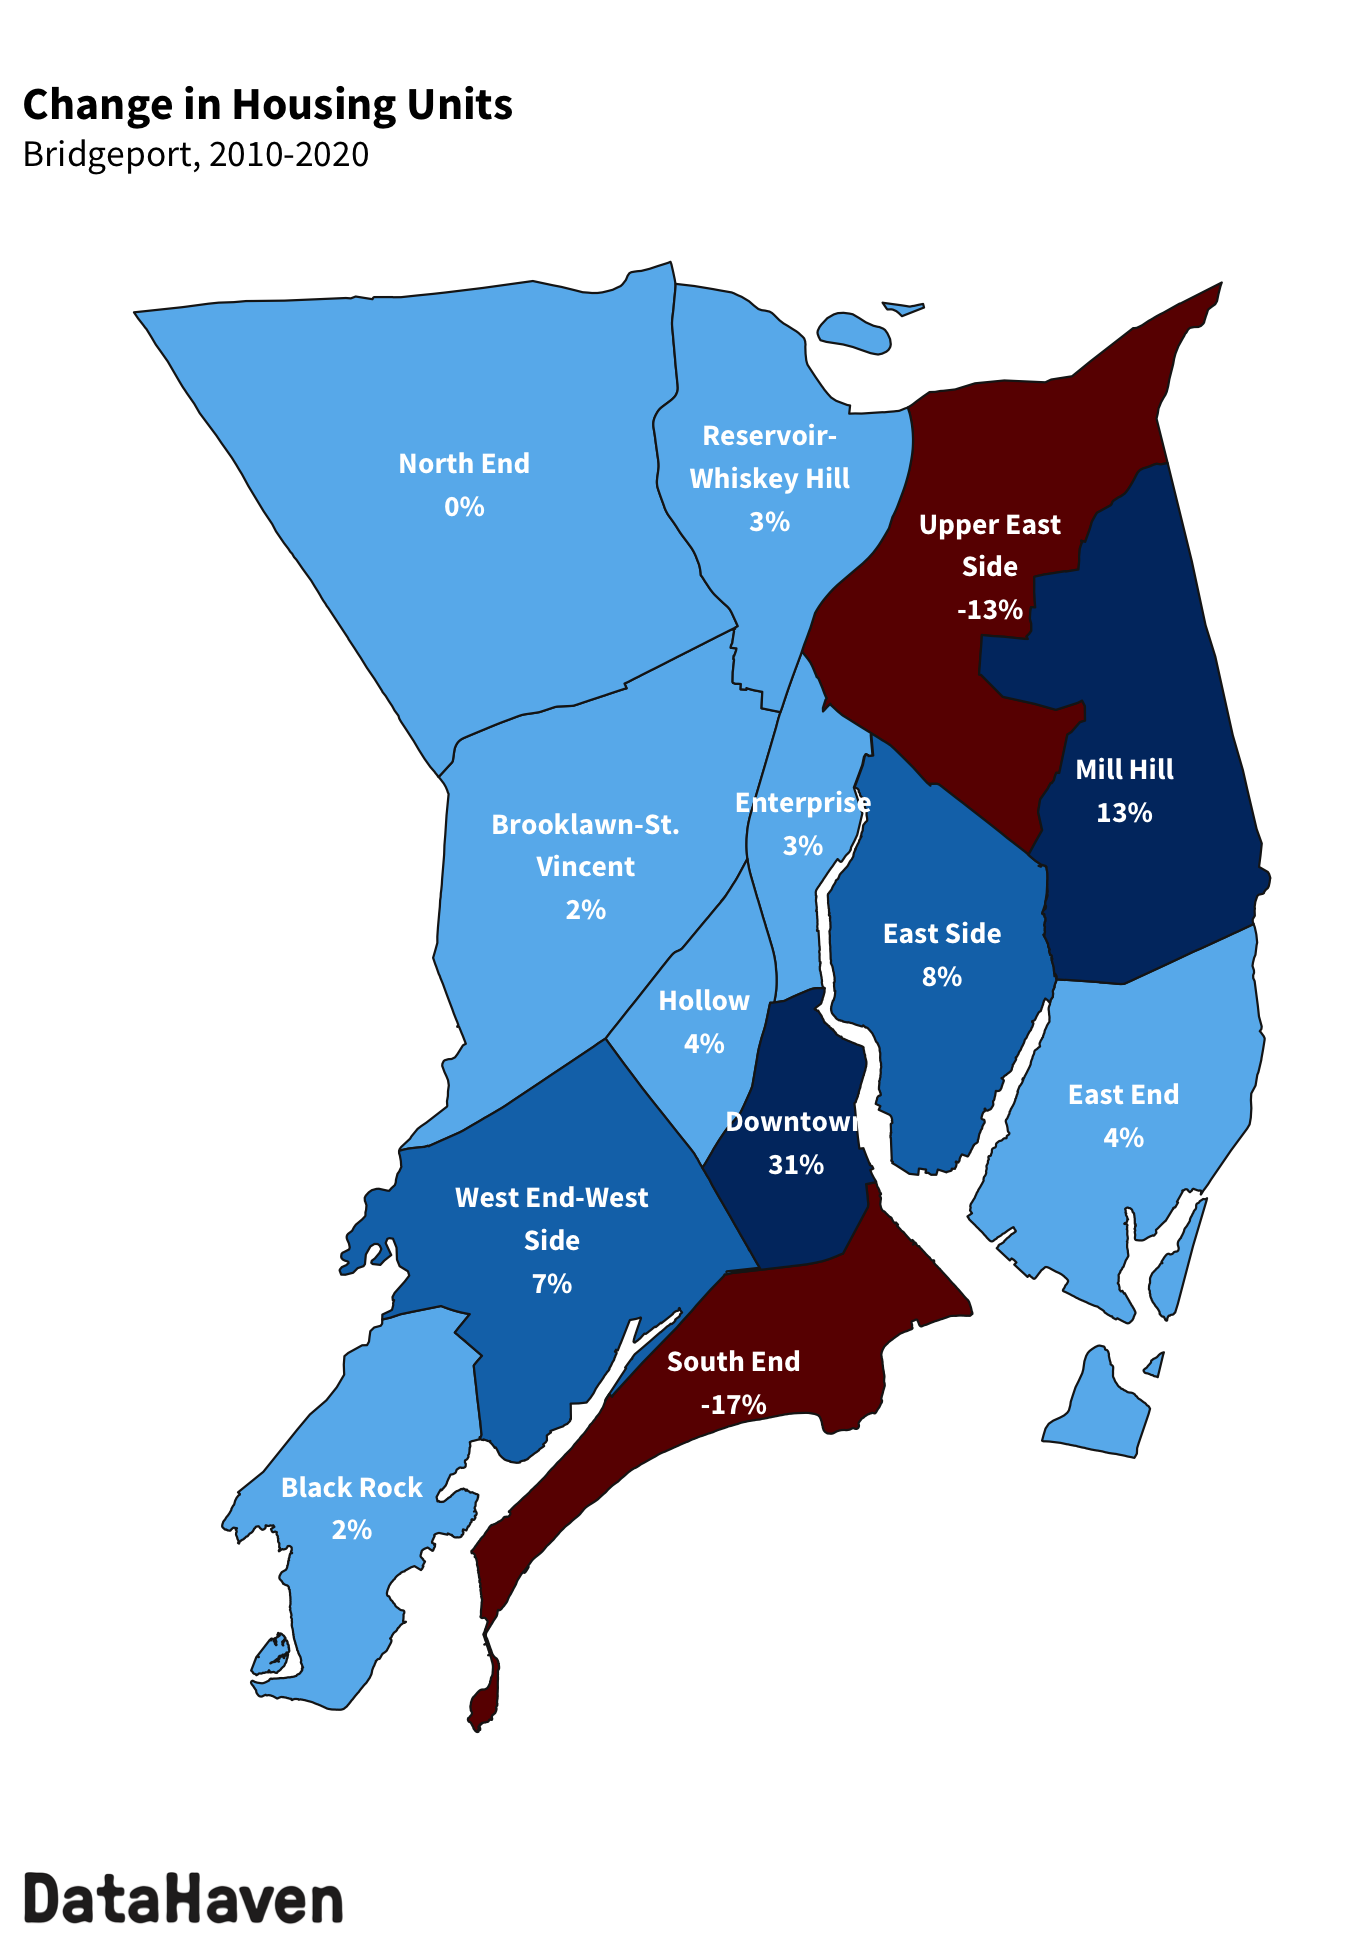
Along with an overall increase in population, Bridgeport registered 1,862 new housing units (3 percent). Mirroring their population growth, Mill Hill had the largest increase in housing units, gaining 712 units (13 percent increase). Downtown experienced the largest relative growth in housing units, gaining 371 units (31 percent increase). All other neighborhoods saw modest increases in the number of housing units, except for Upper East Side and South End, where some public housing complexes were removed or decommissioned over the past decade. Corresponding with their population decline, Upper East Side lost 479 housing units (13 percent decrease) and South End lost 313 units (17 percent decrease).
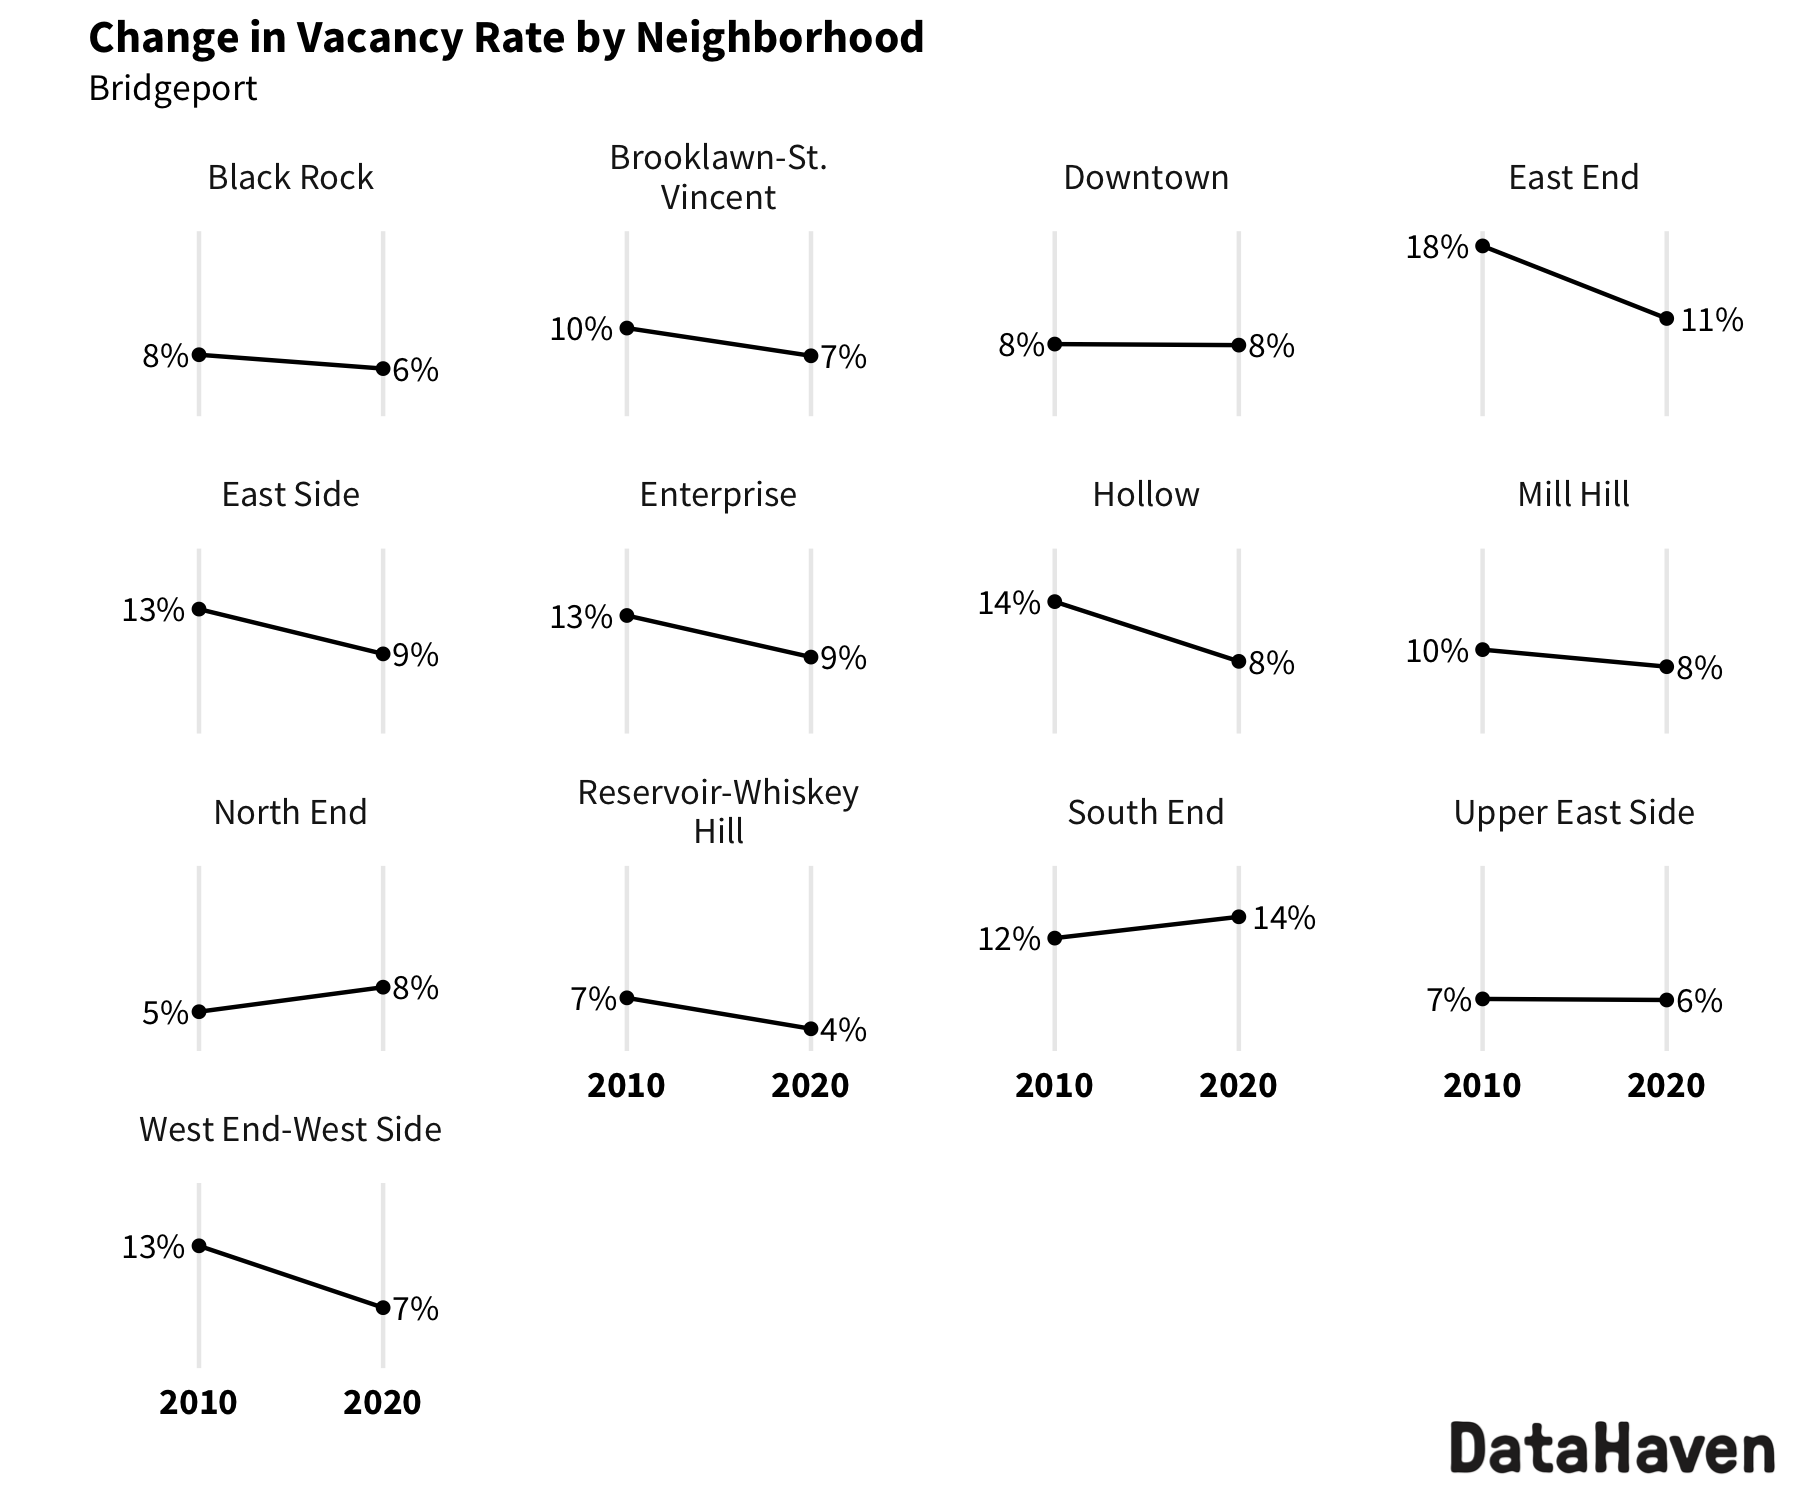
Most neighborhoods also had a decrease in vacancy rate, suggesting a rising demand for housing in the city. Vacancy rate is the share of total housing units that are not occupied and are currently available. The neighborhoods with the steepest decreases in vacancy rates were the neighborhoods in which the increase in housing units did not keep up with the increase in population. East End had the largest decrease in vacancy rate, decreasing from 18 percent to 11 percent. Meanwhile, its population increased by 11 percent and housing units only increased by 4 percent.
As the Census Bureau releases even more detailed information in the coming months, DataHaven and other researchers will develop a deeper understanding of the reasons behind the changes noted here, such as changes in household composition. These data are instrumental for our democracy—not only for creating representative voting districts and guiding the distribution of billions of dollars in federal funding, but also for planning education, housing, and health services and ensuring equitable investment in all of our communities.


