By Kelly Davila, Coral Wonderly, and Mark Abraham
Scroll down to view maps and charts.
Census data highlight dynamic, growing neighborhoods in Stamford
Over the last ten years, Stamford and its neighborhoods have seen significant changes in population size, housing availability, and ethnic and racial makeup.
Between 2010 and 2020, the population of Stamford increased by 12,827 to 135,470 (a 10 percent increase, compared to the 1 percent increase statewide), overtaking New Haven as the second largest city in Connecticut. The adult population rose by 12,533 to 108,715 (a 13 percent increase, compared to the 4 percent increase statewide), and the child population rose by 294 to 26,755 (a 1 percent increase, compared to the 10 percent decrease statewide).
Stamford's growth is part of a trend in which the populations of most of Connecticut’s larger towns increased more quickly than that of the state as a whole. The newly released 2020 decennial census data allows for the most accurate analysis of neighborhood-level demographic changes and trends since the last census in 2010.
Changing racial/ethnic composition
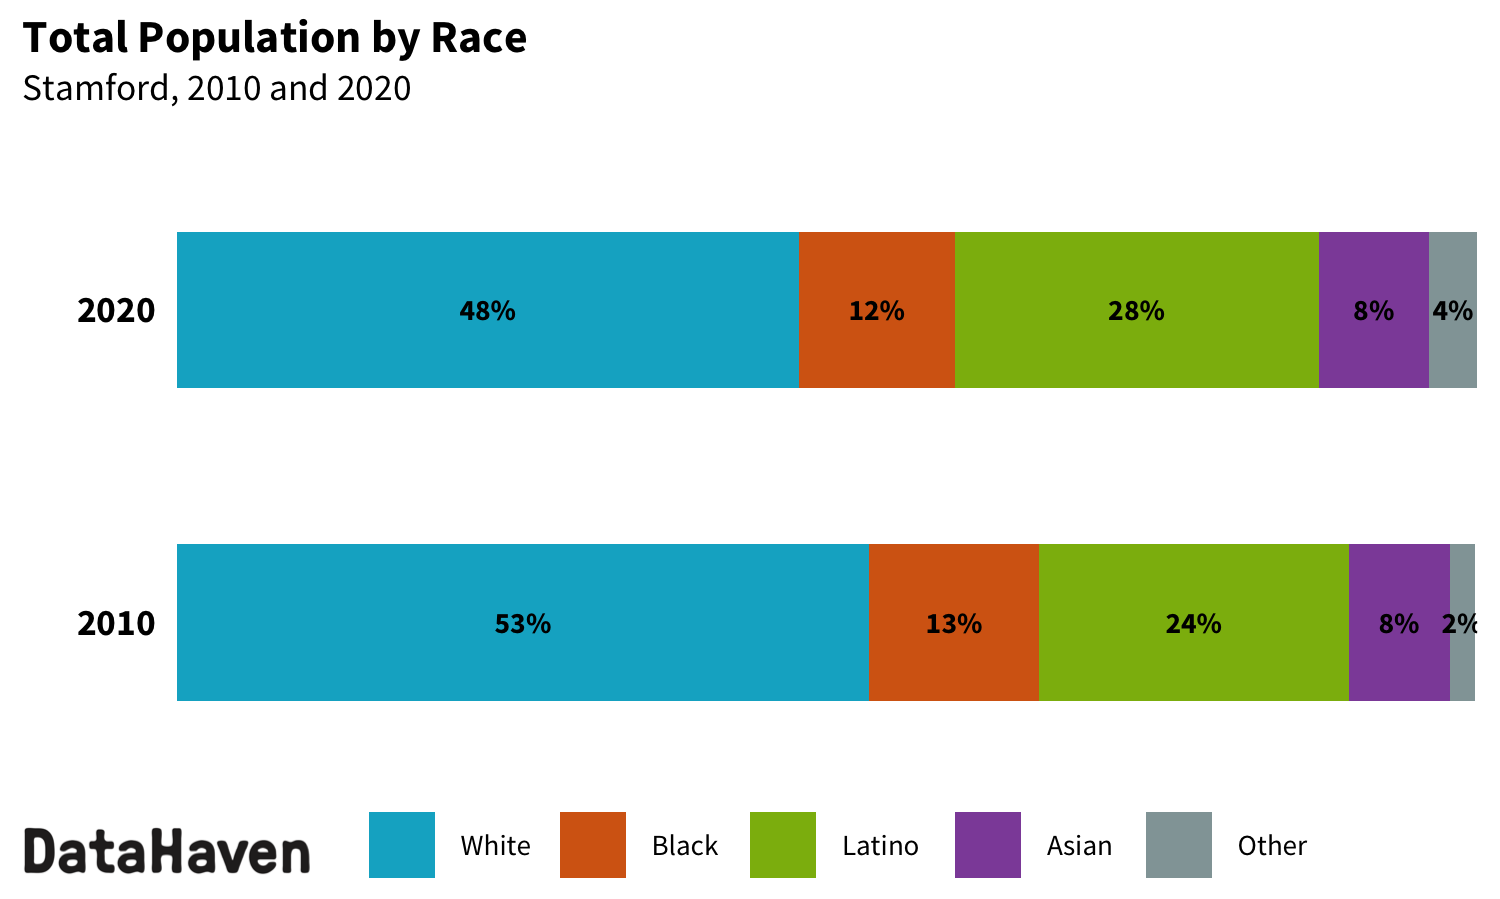
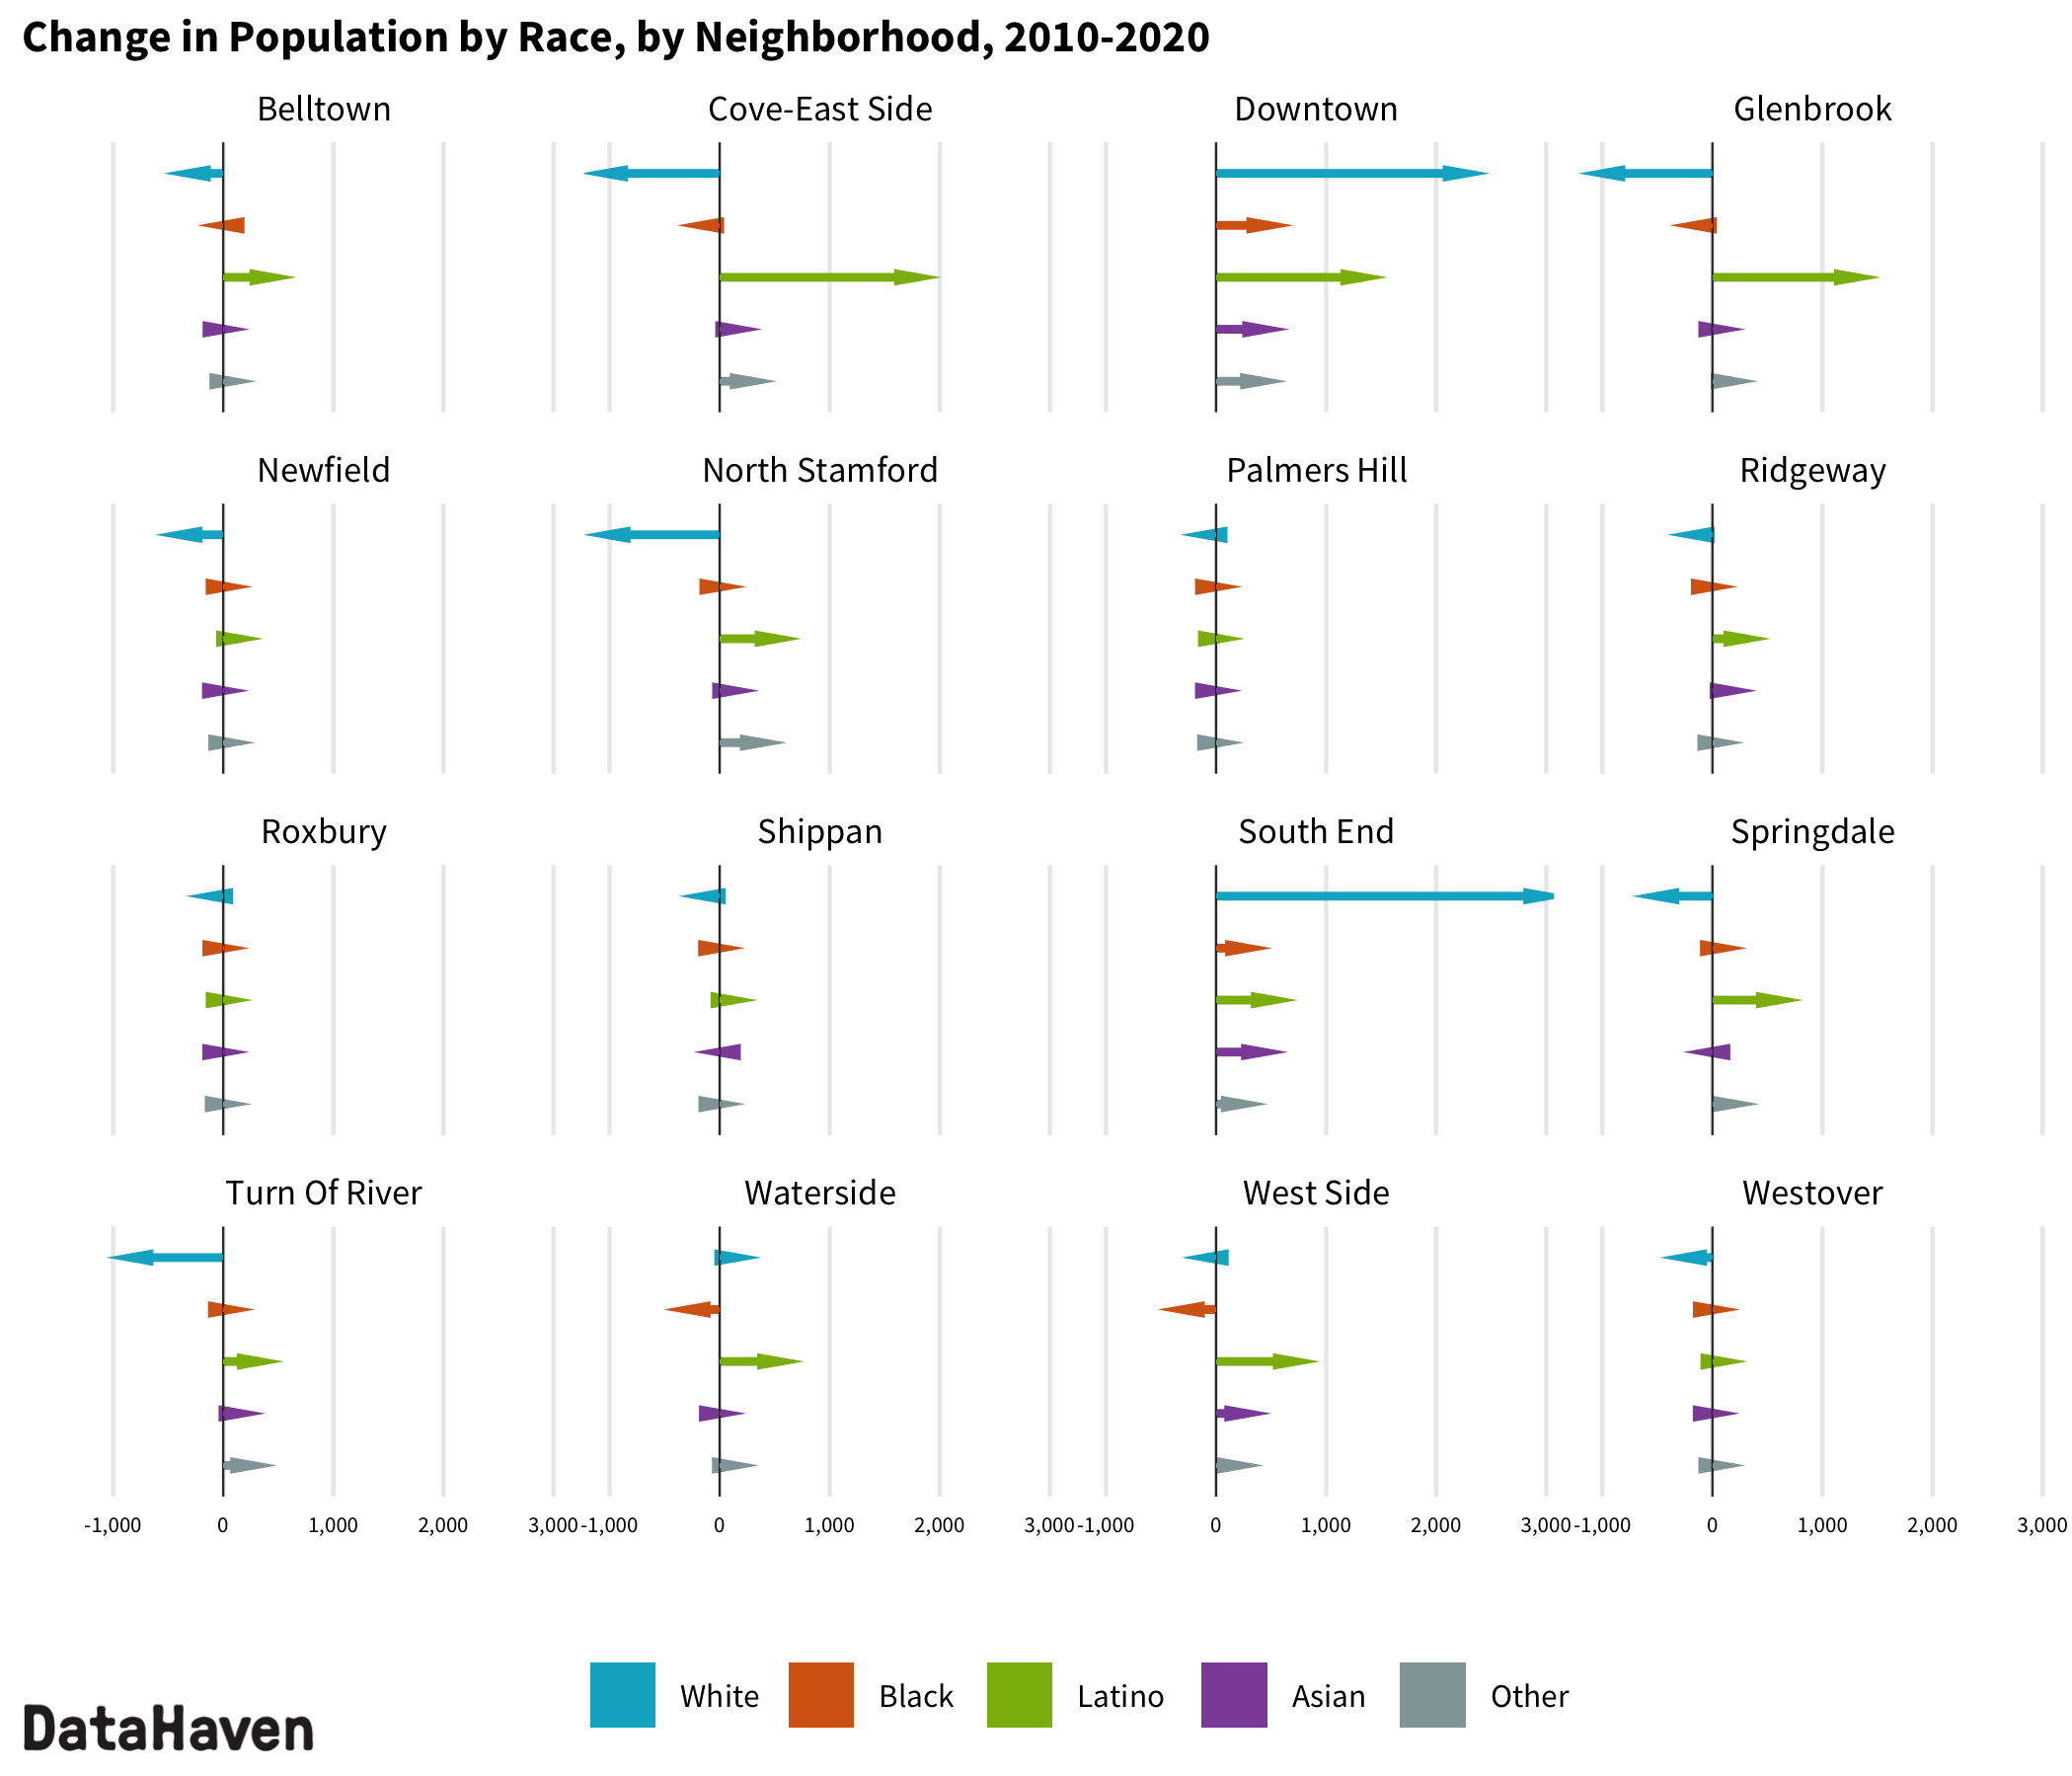
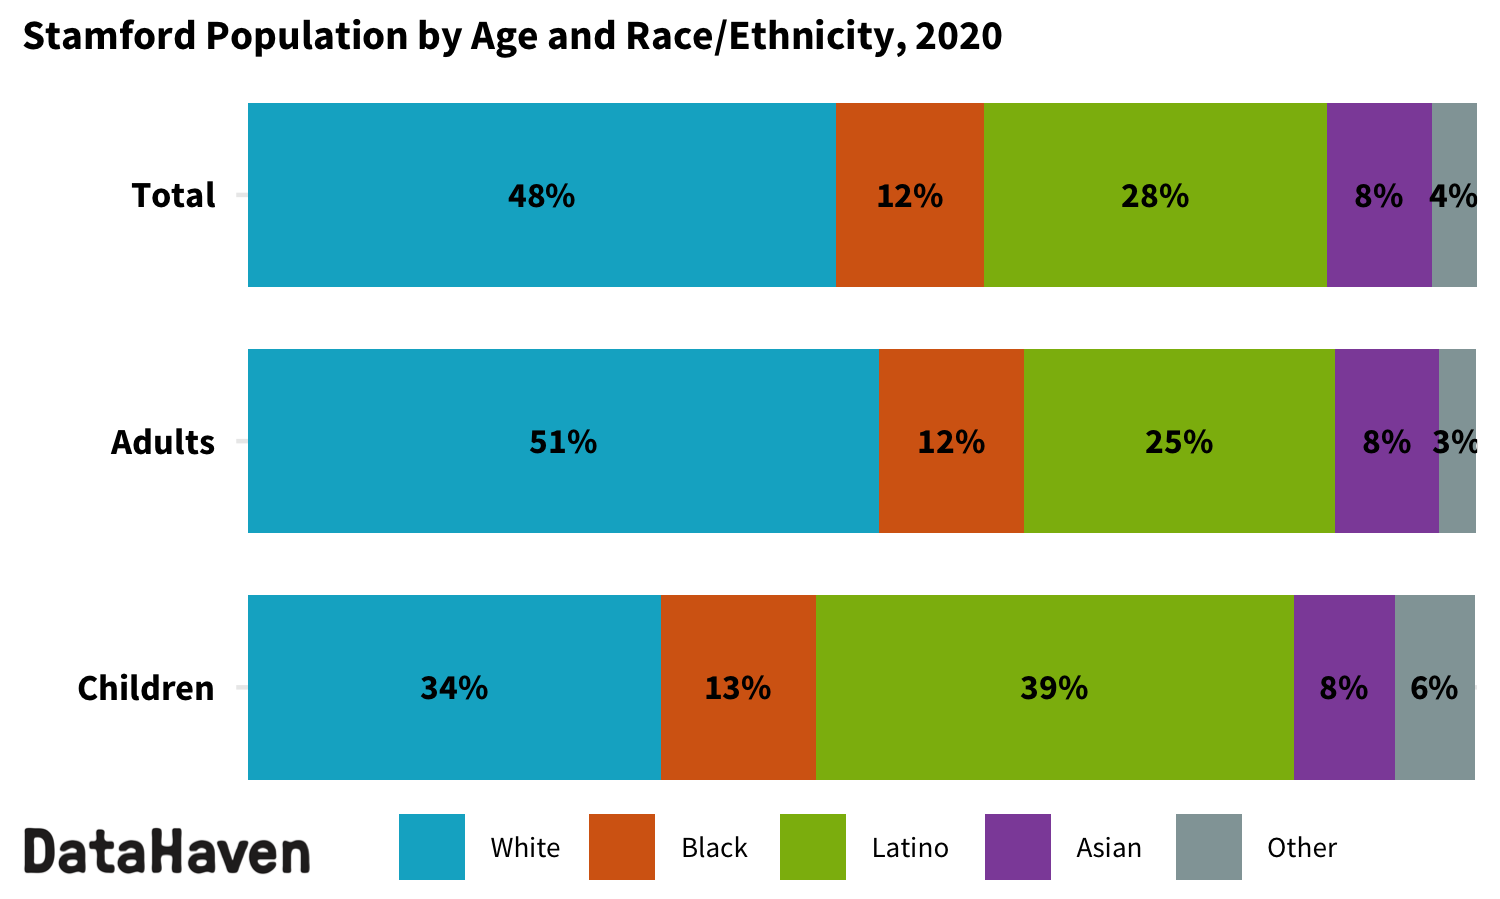
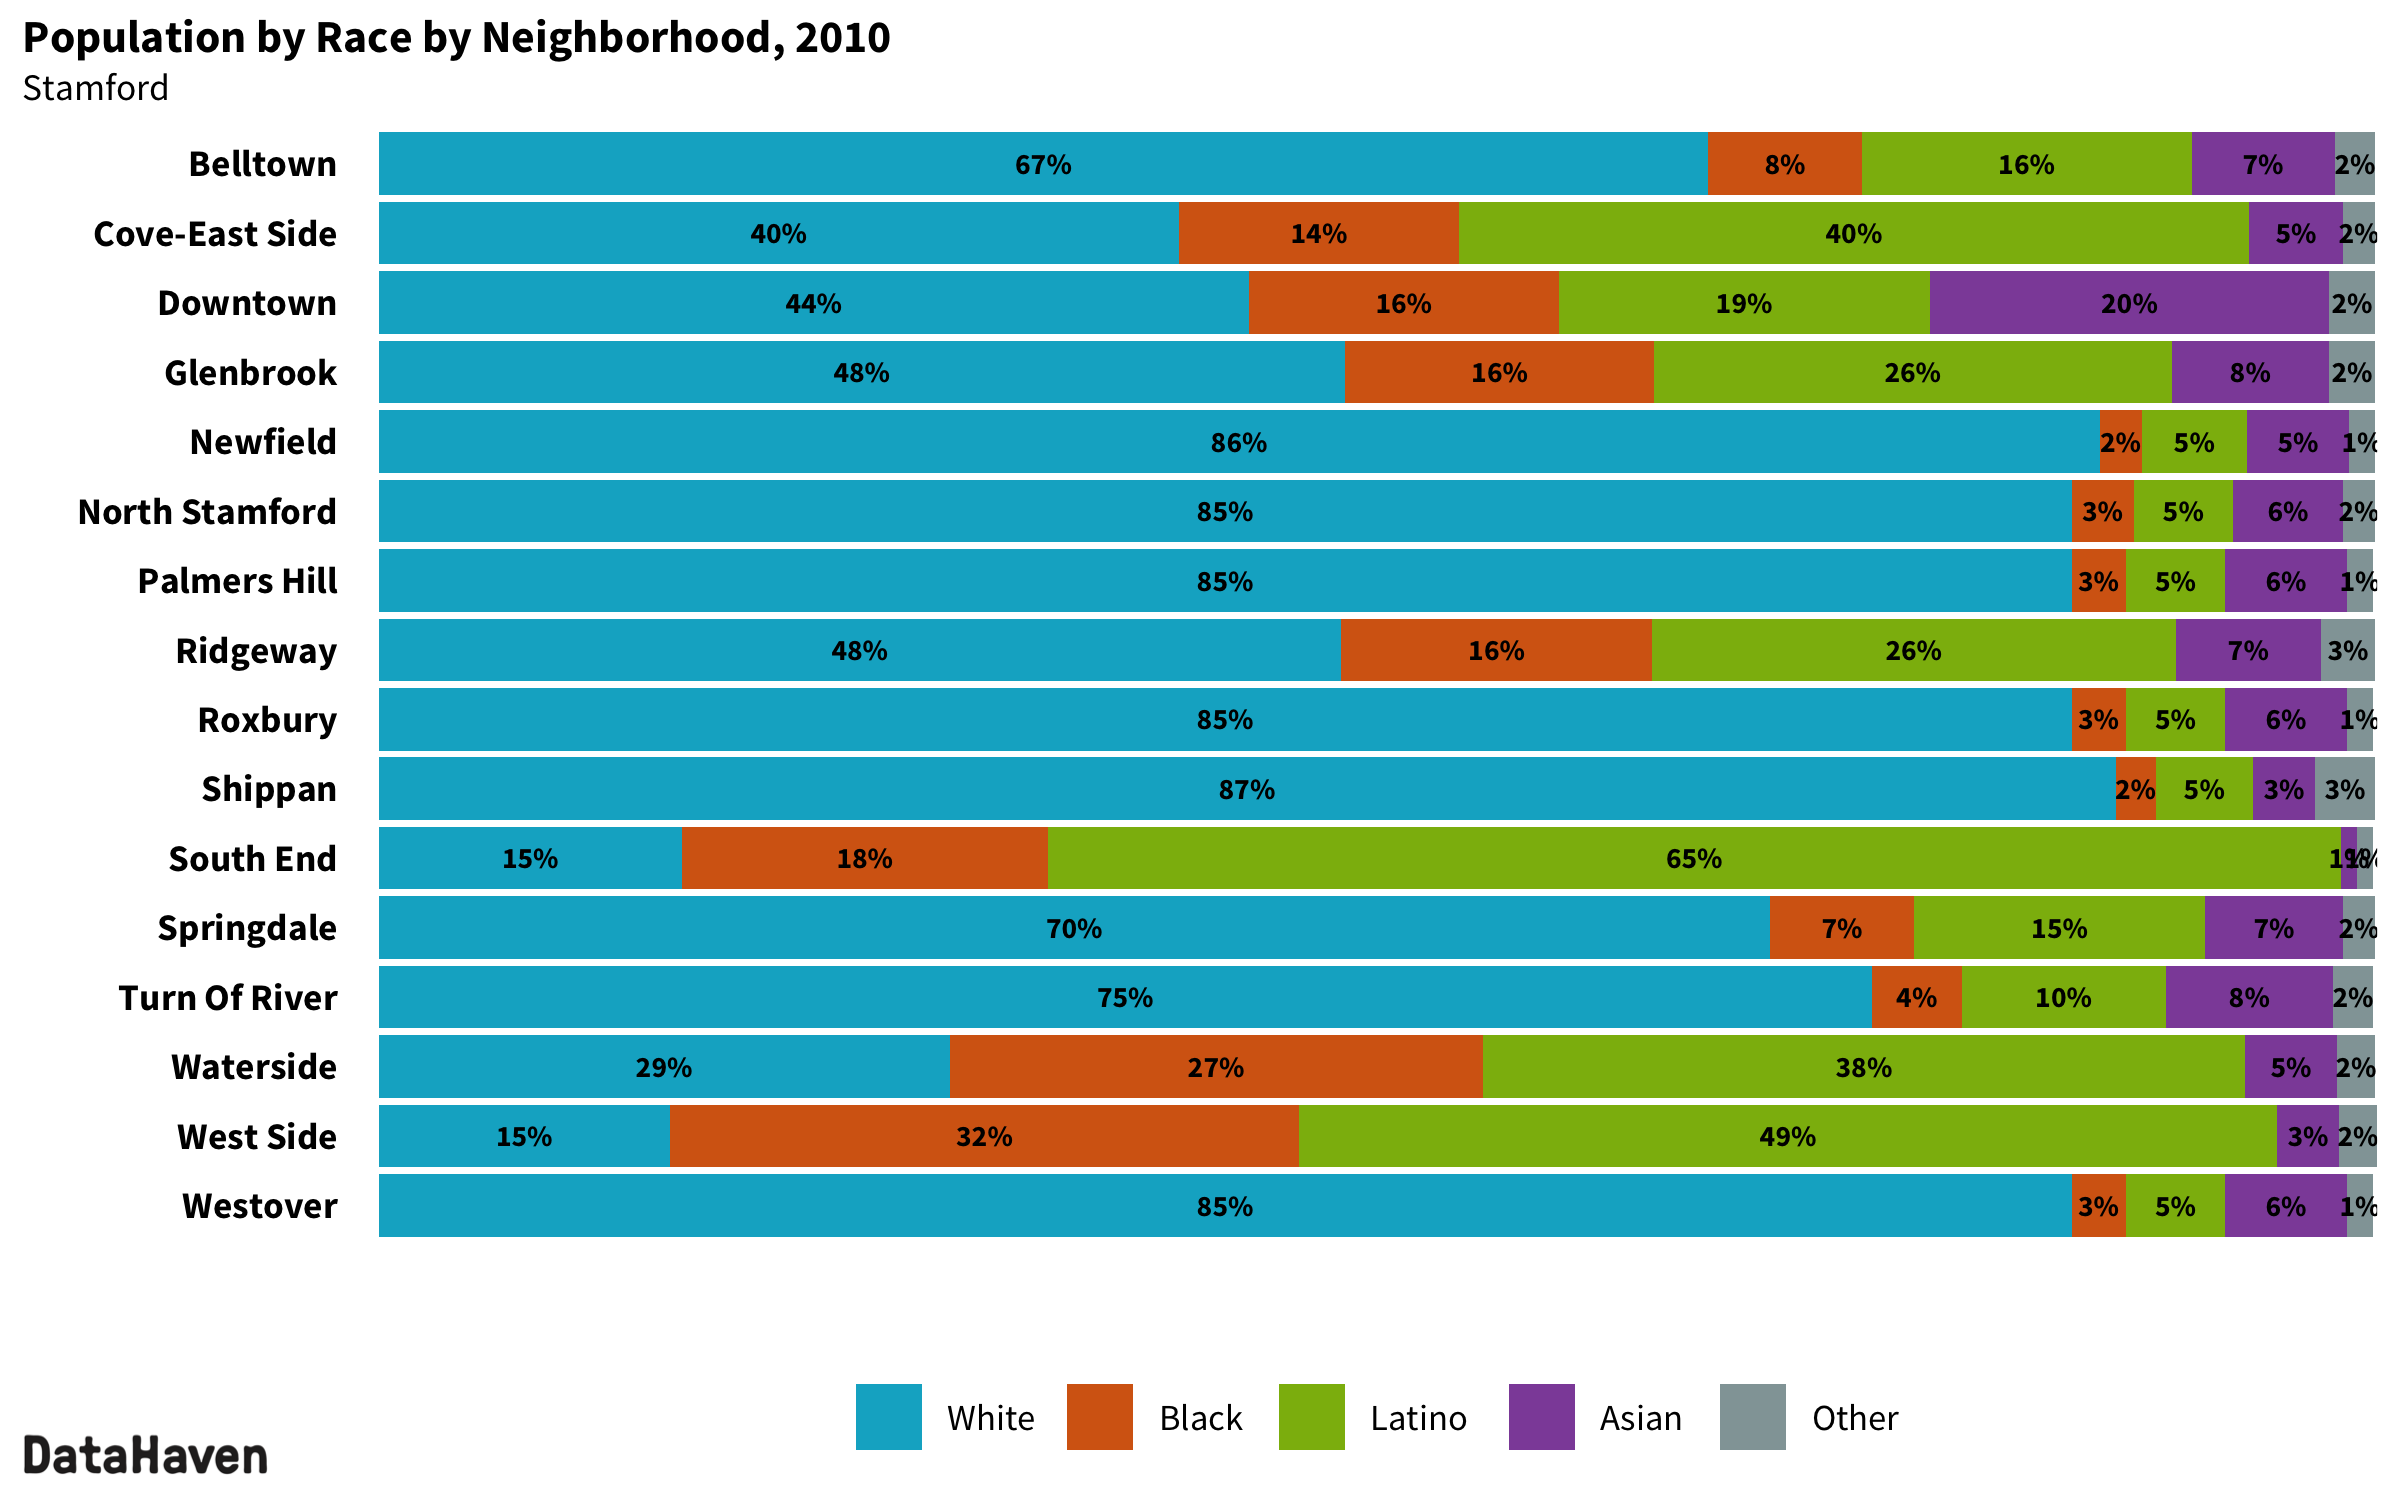
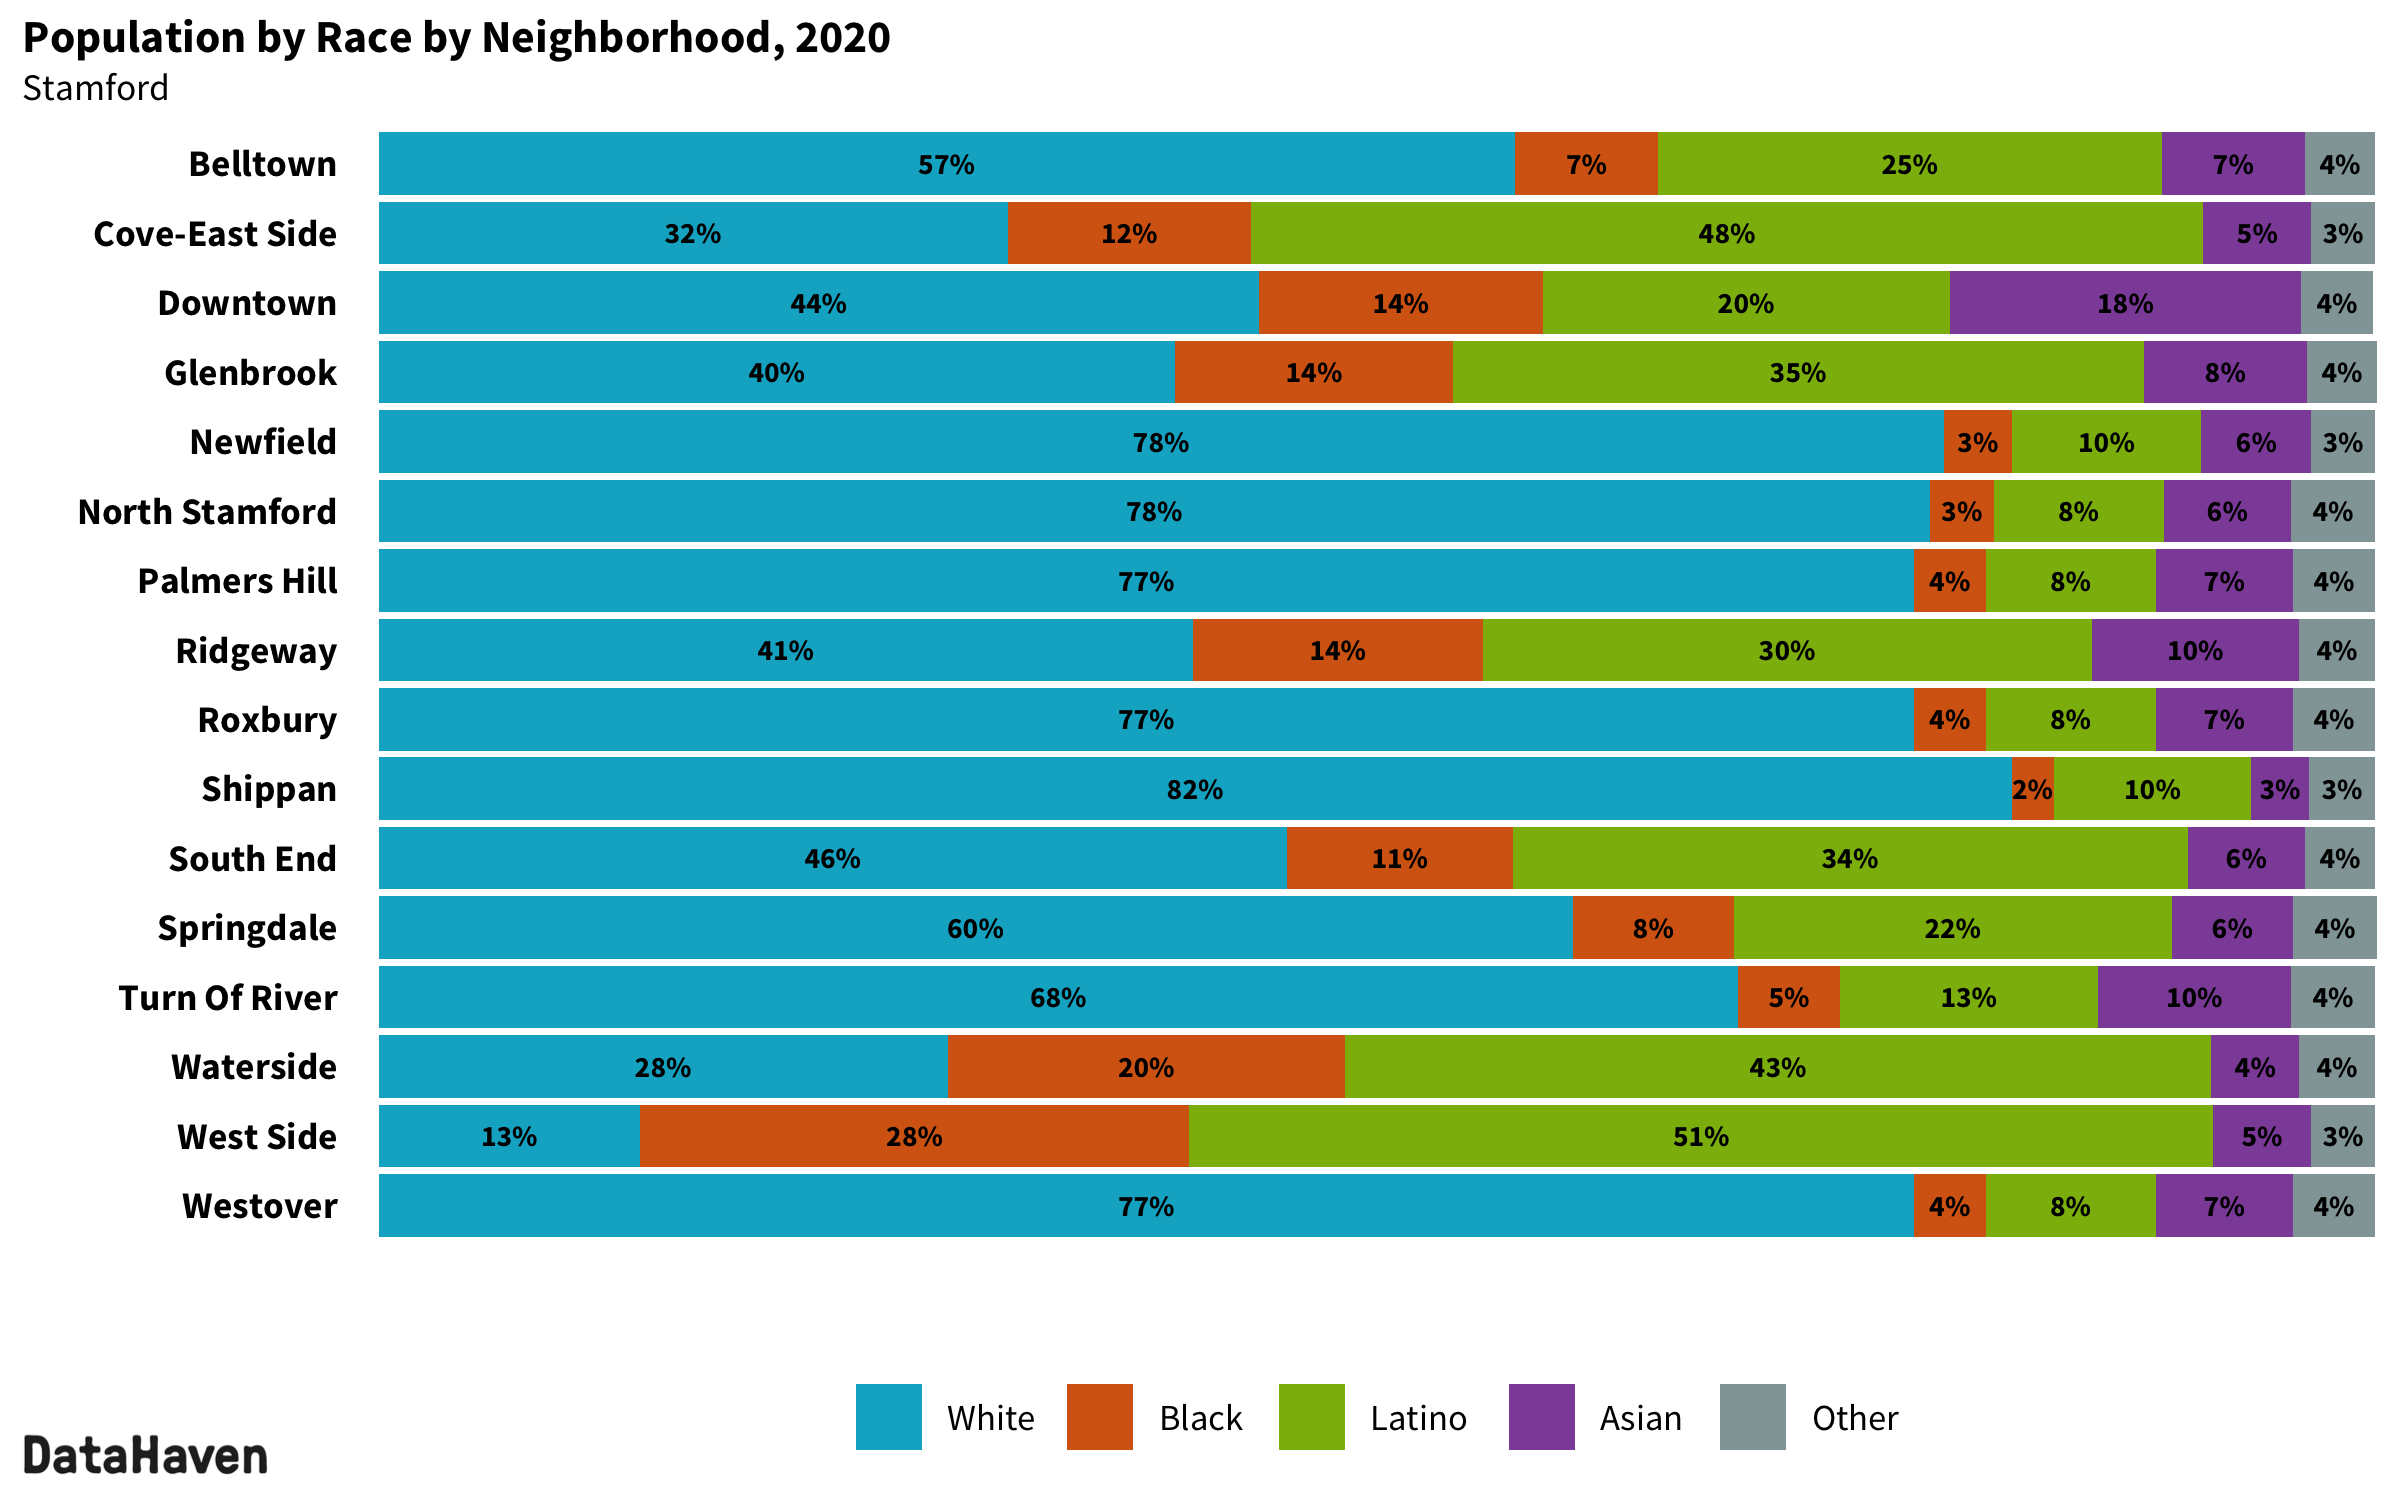
The white population remains the largest demographic group in Stamford, but is no longer a majority, comprising 48 percent of the total population, down from 53 percent in 2010. Neighborhoods where the white population experienced the most change were the South End and Downtown, which each recorded increases of more than 2,000 white residents. The white population declined by close to 1,000 residents in North Stamford, Glenbrook, Cove-East Side, and Turn Of River.
Similar to national trends, Stamford’s Latino population is the city’s fastest-growing demographic, increasing 8,770 residents. Latinos now comprise 28 percent of the population, up from 24 percent in 2010. Neighborhoods where the Latino population saw a net gain of 1,000 or more new residents were Cove-East Side, Downtown, and Glenbrook, but many other neighborhoods also recorded significant increases.
The Black population of Stamford remained relatively unchanged, increasing by 95 residents. The Black population makes up 12 percent of the population of Stamford, down from 13 percent in 2010.
The Asian population increased by 1,849 residents (19 percent), and individuals in all other racial/ethnic groups more than doubled with 562 additional residents. The latter group includes people who identify as two or more races, as well as small Pacific Islander and Native American groups.
Neighborhood population and housing trends
The 10 percent increase in Stamford’s population followed the statewide trend in which the 10 largest cities collectively gained 37,109 residents while the remaining 159 towns collectively lost 5,262 residents. However, the change in population did not evenly affect all of Stamford’s neighborhoods.
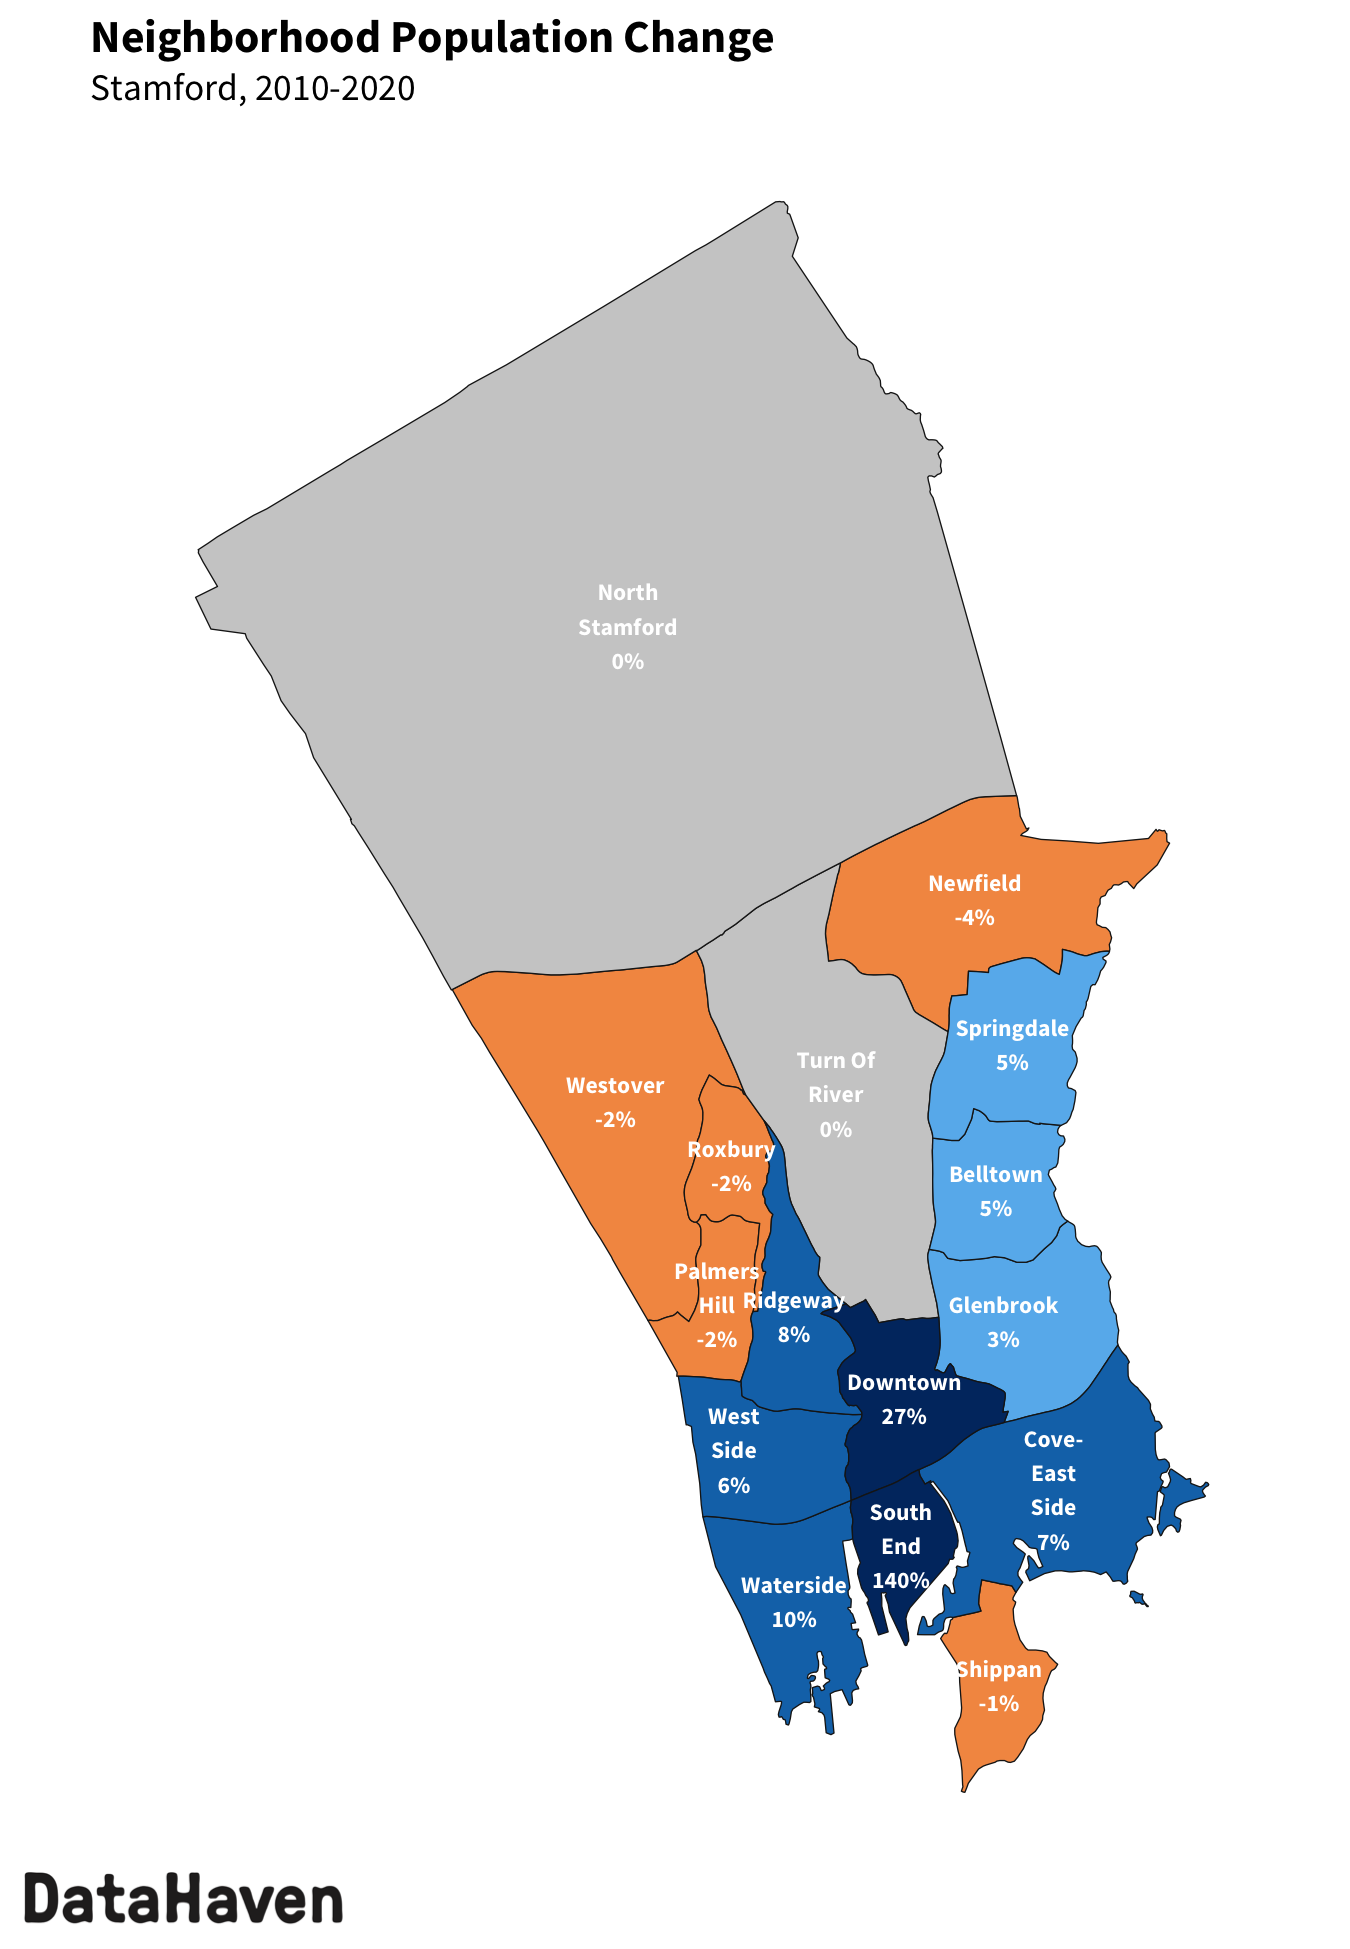
Downtown had the largest increase in population, gaining 4,917 new residents (27 percent increase). The South End neighborhood experienced the largest relative increase in population, growing by 4,455 residents (140 percent increase). Most neighborhoods adjacent to downtown also experienced modest growth. Meanwhile, six neighborhoods saw small declines in the population. Newfield experienced the biggest decrease in population, losing 147 residents (4 percent decrease).
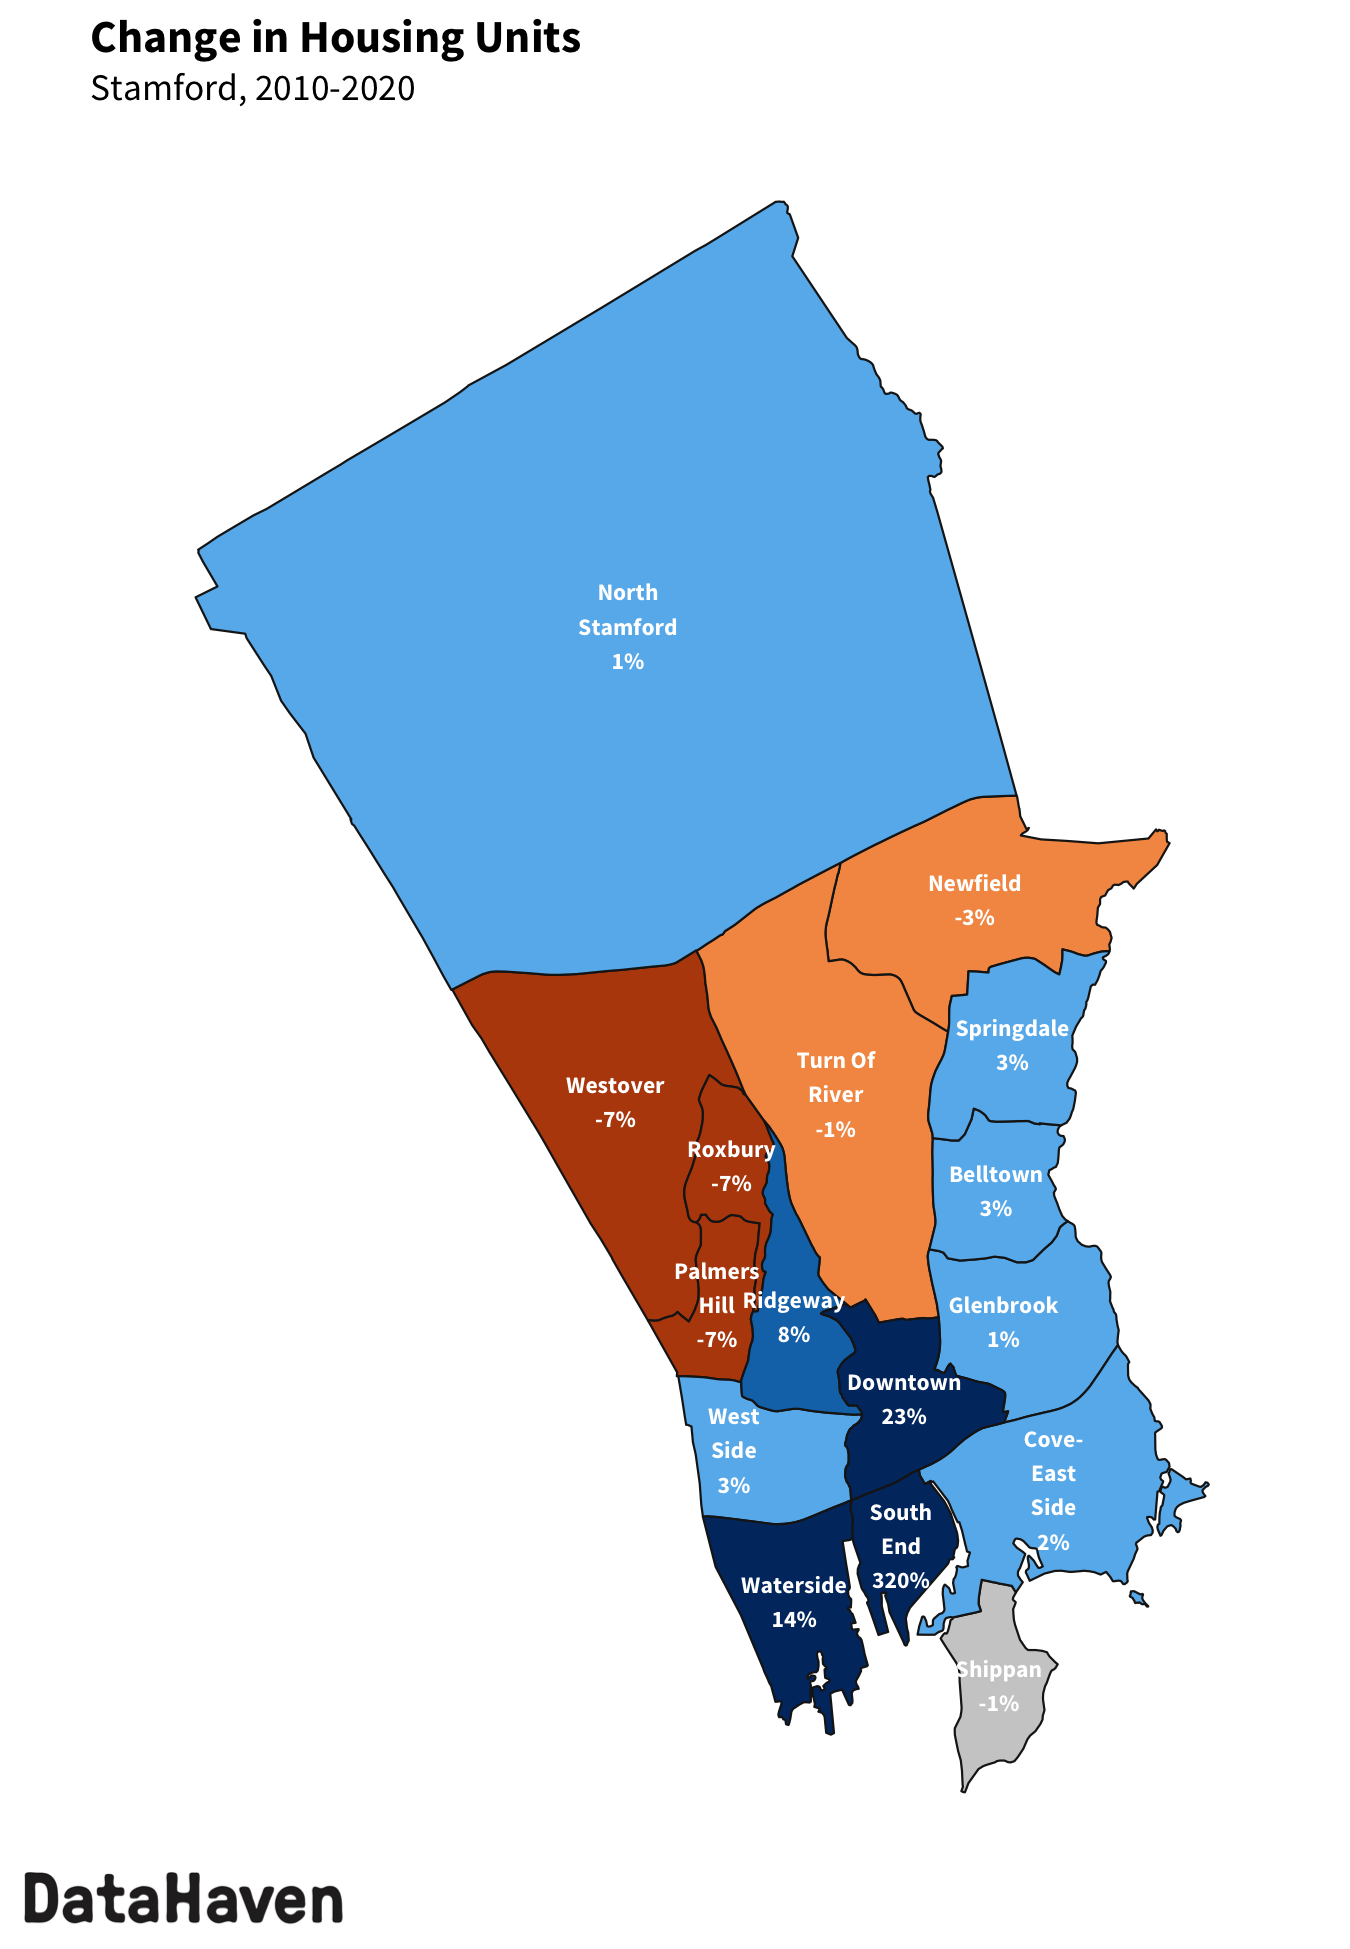
Along with an increase in population, Stamford also registered 6,381 new housing units (13 percent). Due to major redevelopment efforts, the South End had the largest increase in housing units, gaining 3,215 units (320 percent), and the Downtown neighborhood also experienced a significant increase in housing units, gaining 2,402 units (23 percent). A few neighborhoods saw modest declines; for example, Westover lost 74 units (a 7 percent decrease).
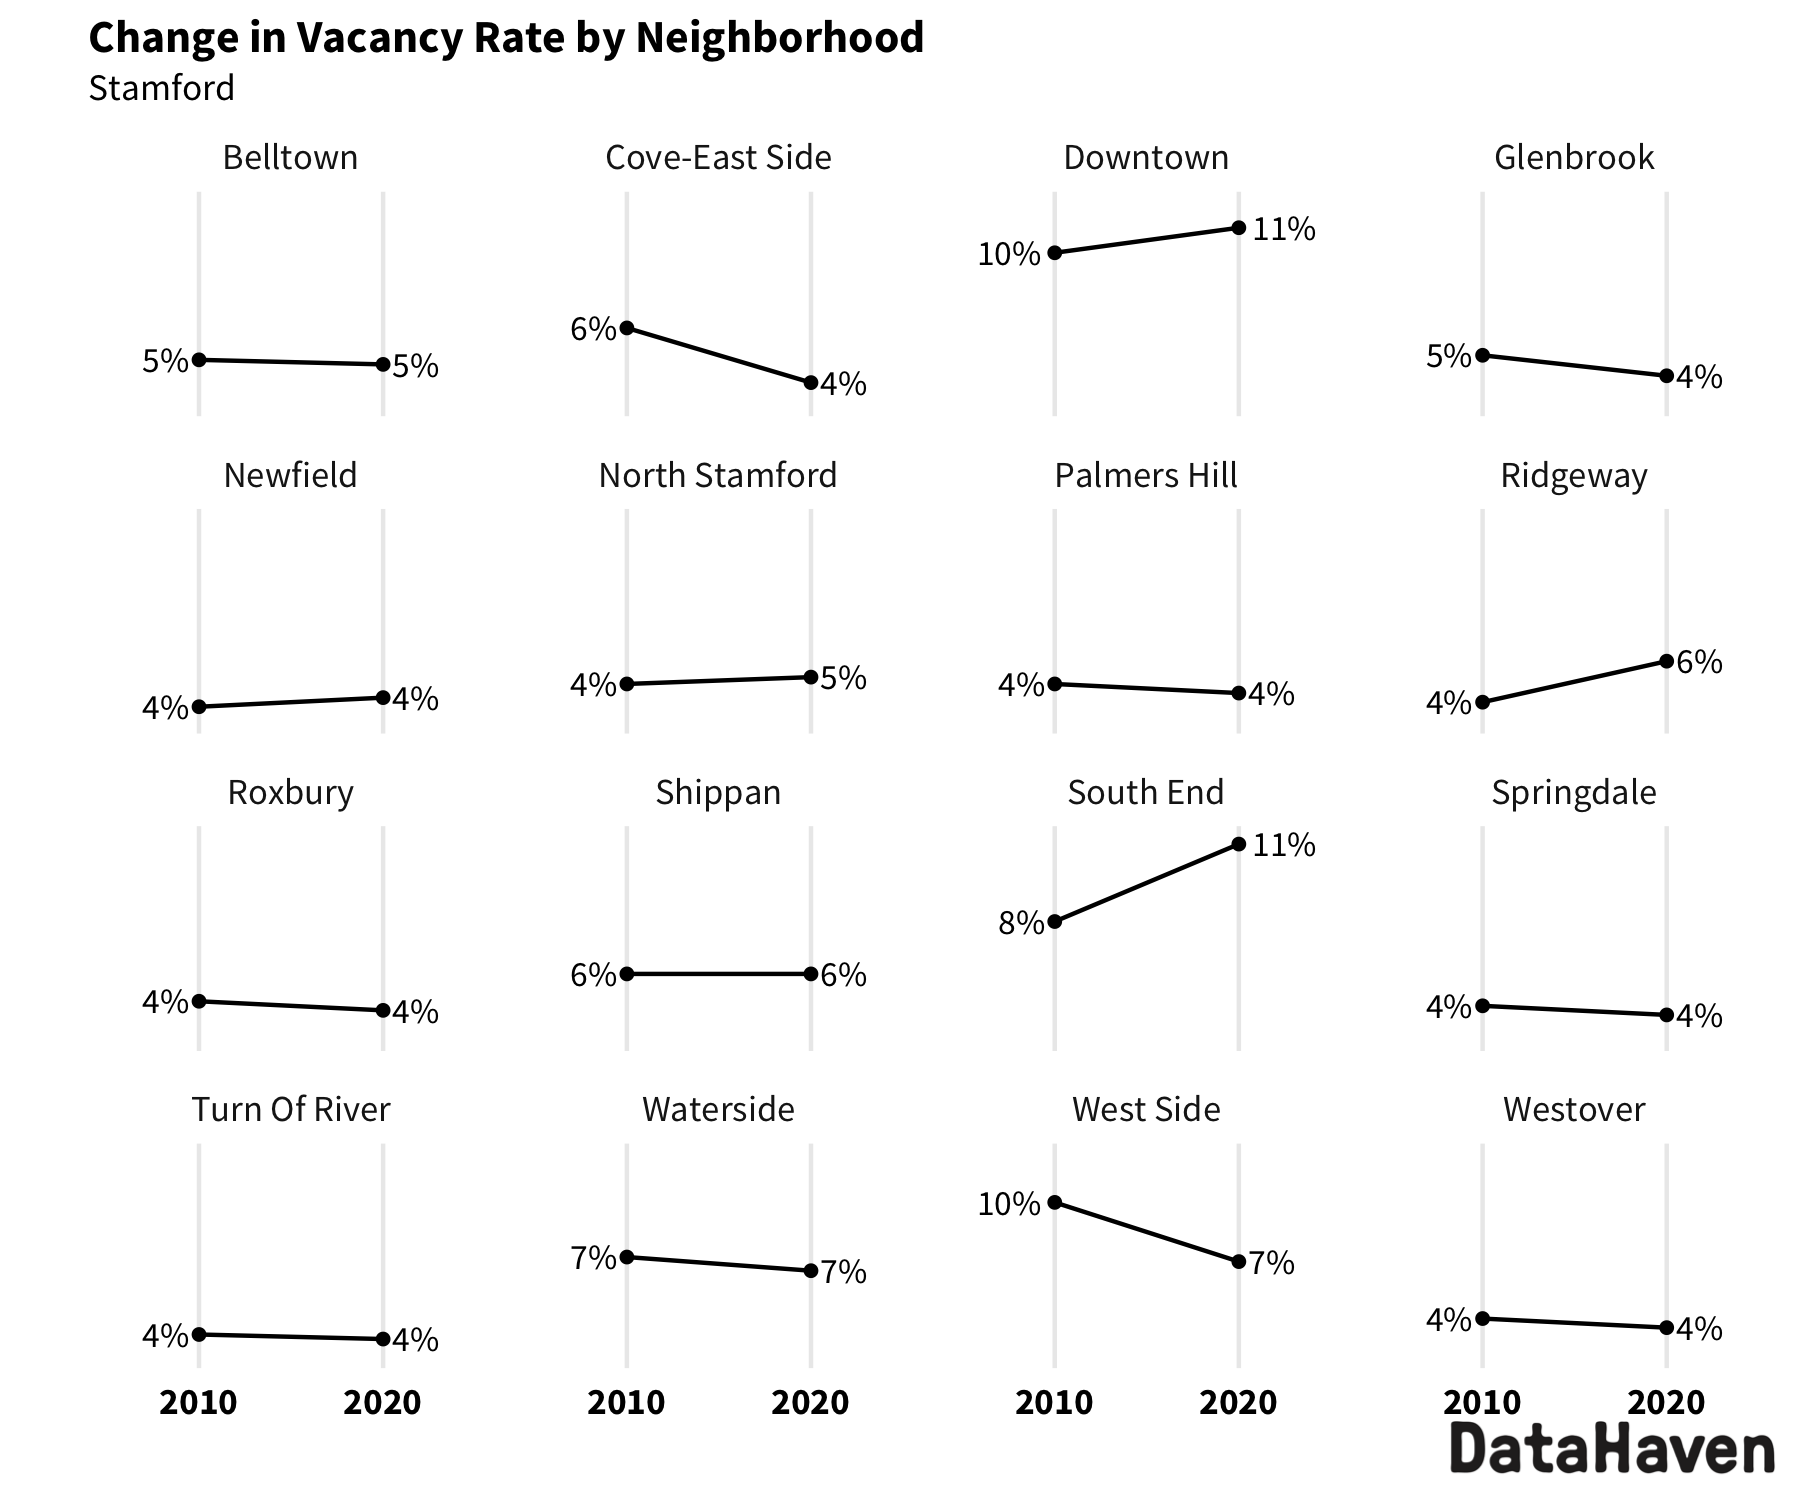
Most neighborhoods in Stamford experienced less than a one percentage point change in the vacancy rate. South End had the largest increase in vacancy rate, increasing from 8 percent to 11 percent due to experiencing a larger increase in housing units than residents. However, local-level housing vacancy rates shift continuously due to a range of factors including renovations and the leasing up of newly-constructed apartment buildings.
As the Census Bureau releases even more detailed information in the coming months, DataHaven and other researchers will develop a deeper understanding of the reasons behind the changes noted here. These data are instrumental for our democracy—not only for creating representative voting districts and guiding the distribution of billions of dollars in federal funding, but also for planning education, housing, and health services and ensuring equitable investment in all of our communities.


