By Kelly Davila, Coral Wonderly, and Mark Abraham
Scroll down to view maps and charts.
2020 Census data highlight growing housing stock, especially downtown
Over the last ten years, Hartford and its neighborhoods have seen changes in population size, housing availability, and ethnic and racial makeup. Between 2010 and 2020, the population of Hartford decreased by 3,721 people (3 percent decrease), an exception to a trend in which the populations of most of Connecticut’s larger towns increased more quickly than that of the state as a whole. However, despite the decrease in population, the demographic makeup of Hartford and its neighborhoods has changed significantly. The newly released 2020 decennial census data allows for the most accurate analysis of these neighborhood-level demographic changes and trends since the last census in 2010.

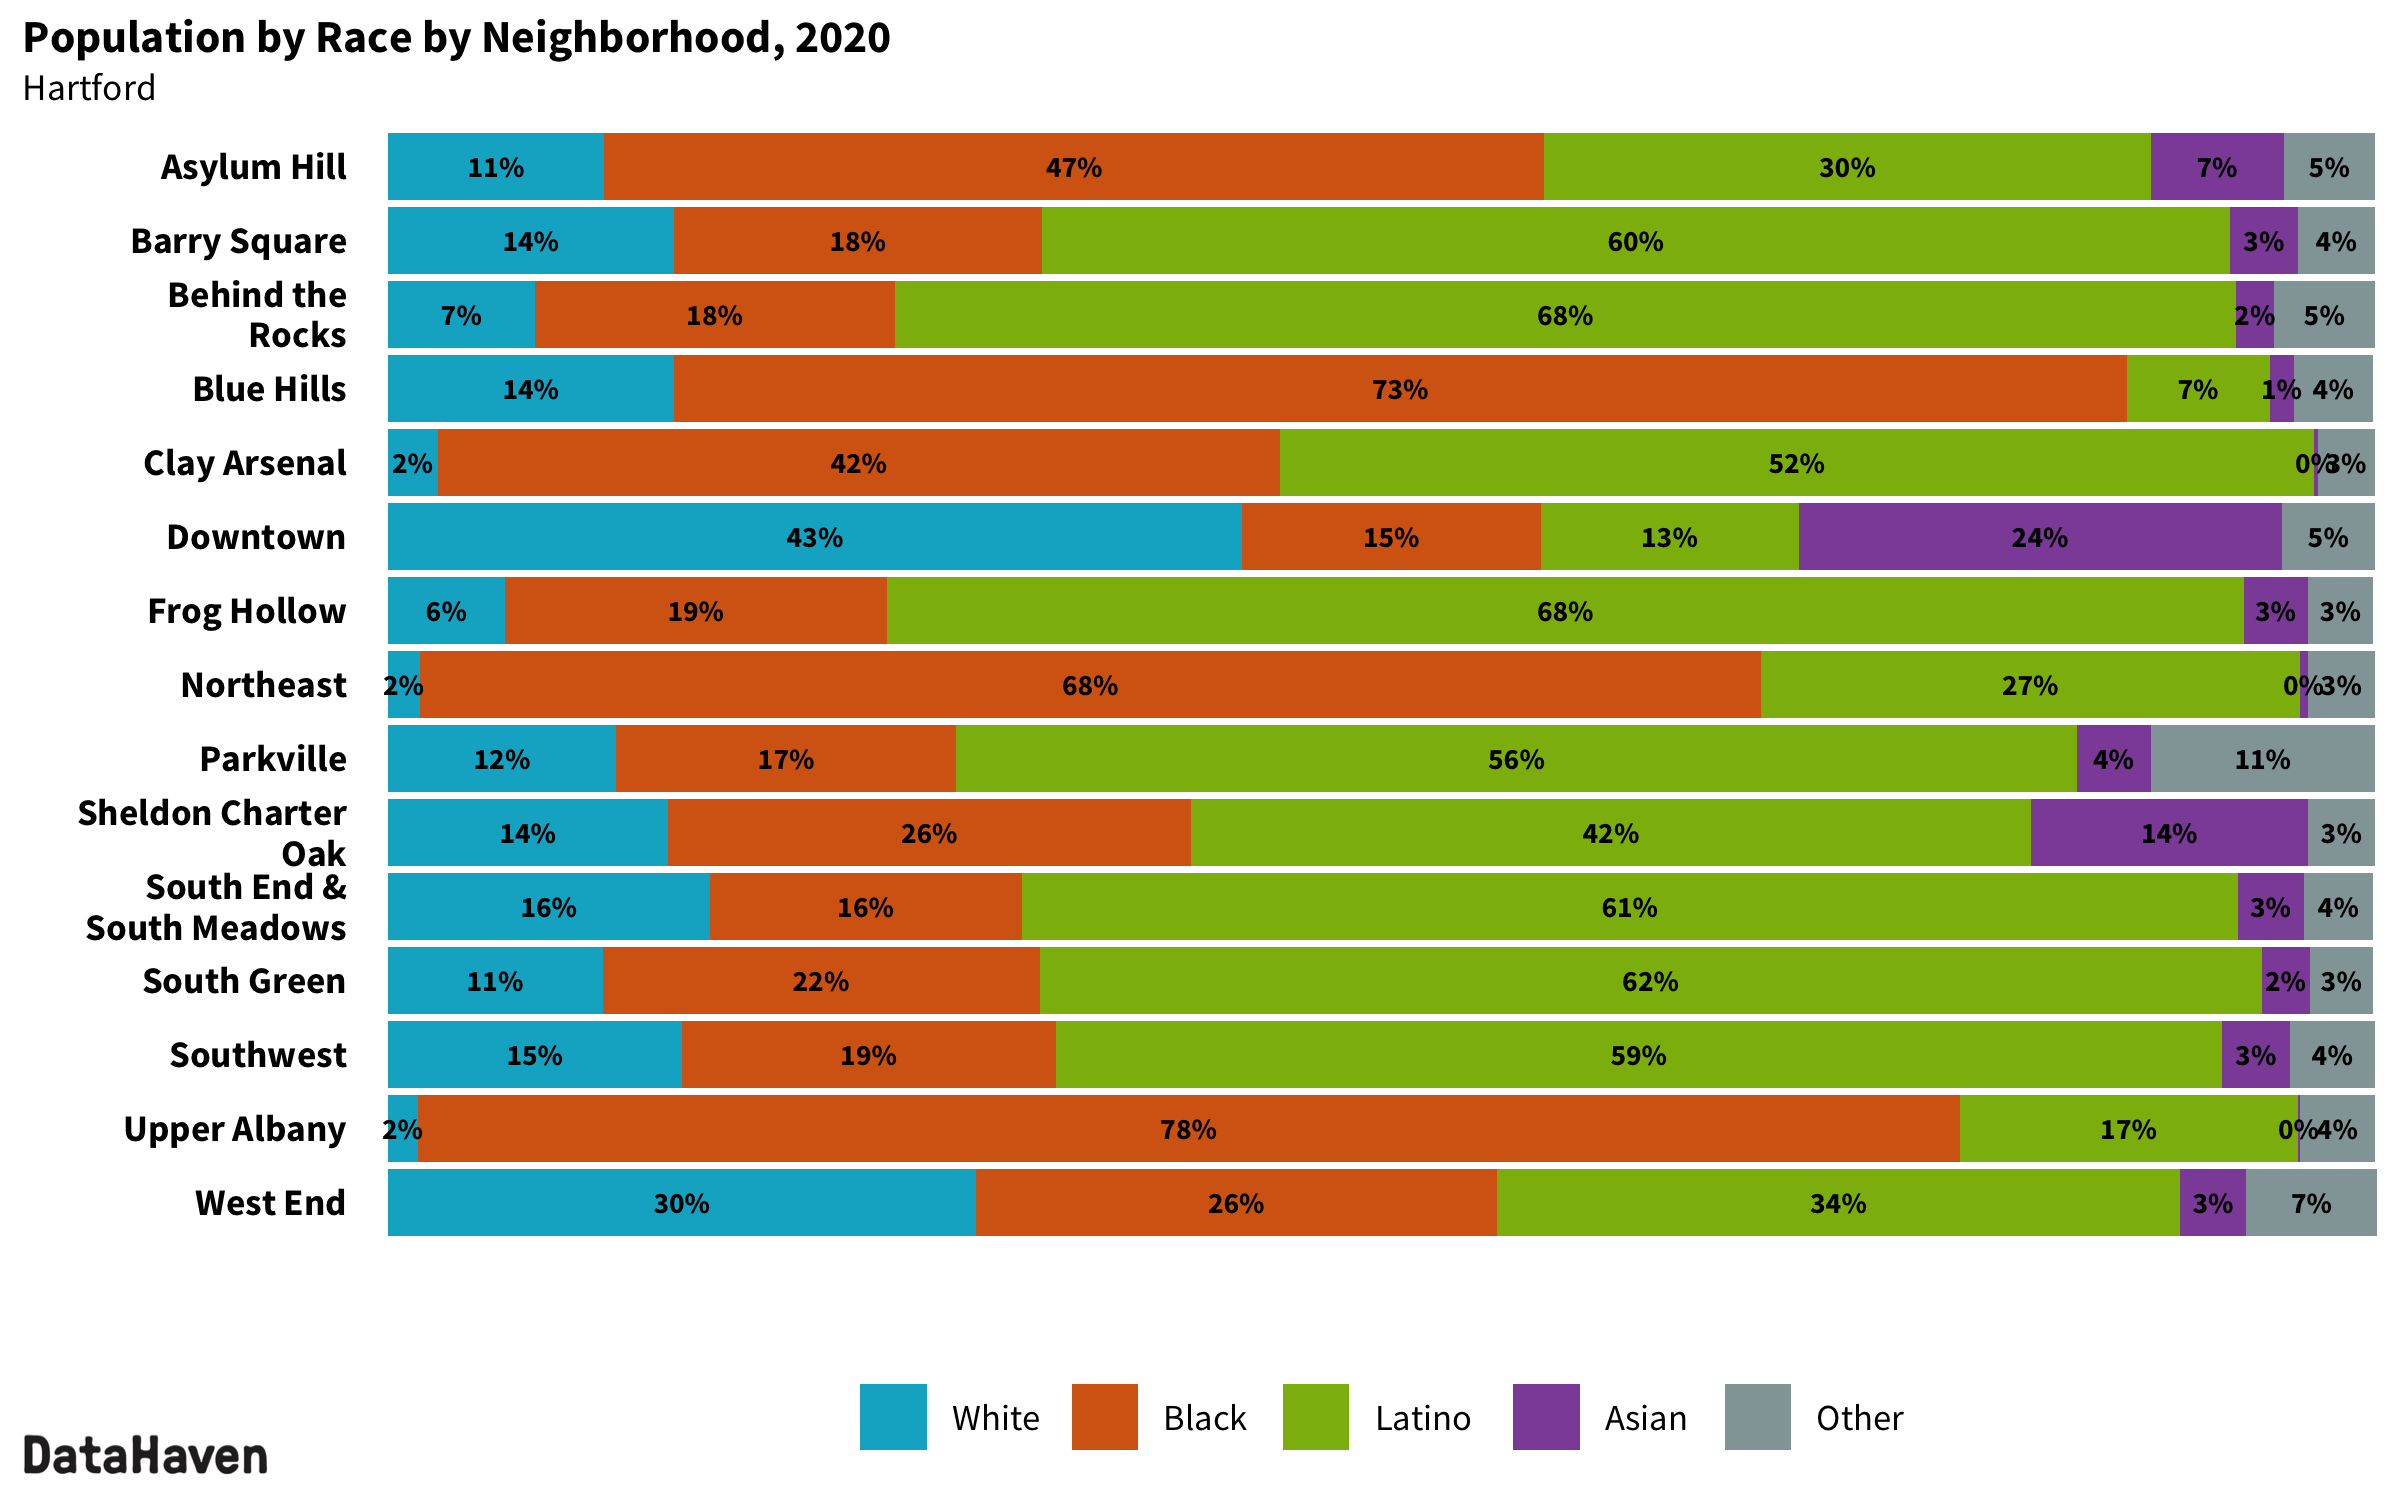
Changing racial/ethnic composition
The Latino population continued to be the largest racial/ethnic group in Hartford, comprising 44 percent of the city’s population in 2020, the same share as in 2010. Neighborhoods where the Latino population experienced the most change are Frog Hollow, Parkville, Behind the Rocks, and Barry Square, which each recorded a loss of several hundred Latino residents, and Northeast Hartford, South End/South Meadows, and West End, which each gained several hundred Latino residents.
The Black population of Hartford decreased by 1,199 individuals (3 percent). The Black population makes up 36 percent of the city, up from 35 percent in 2010. Neighborhoods where the Black population experienced the most changes were Upper Albany and Blue Hills. Both neighborhoods recorded a loss of at least 500 Black residents.
The white population of Hartford decreased by 4,487 individuals (23 percent) and now makes up 12 percent of the population, down from 16 percent in 2010. Neighborhoods where the white population recorded significant declines included the South End/South Meadows, Barry Square, Blue Hills, Southwest, and West End.
The Asian population increased by 861 residents (26 percent), with most of that increase in Downtown. Individuals in all other racial/ethnic groups combined increased by 3,942 residents (43 percent). This group includes people who identify as two or more races, as well as small Pacific Islander or Native American groups.


Neighborhood population and housing trends
The 3 percent decrease in Hartford’s population did not evenly affect all of Hartford’s neighborhoods. Downtown Hartford experienced an increase in population, gaining 980 new residents (53 percent), and smaller increases were also recorded in Sheldon Charter Oak, Northeast, West End, Asylum Hill, and Clay Arsenal.
Blue Hills had the largest population decrease, losing 1,525 residents (13 percent decrease), most likely for reasons discussed below. Parkville and South Green also experienced large decreases in population, losing 861 and 406 residents, respectively, and several adjacent neighborhoods in the south side of Hartford, such as Frog Hollow, also saw significant decreases.
Even as the population of Hartford decreased, the city registered 1,431 new housing units (3 percent increase). Mirroring its population trend, Downtown had the largest increase in the number of housing units, gaining 813 units (55 percent increase). Other city neighborhoods also recorded gains in the number of housing units, except for Blue Hills, Parkville, and South Green. Blue Hills, where the 1950s-era Bowles Park public housing complex was demolished and replaced with smaller-scale construction, lost 670 housing units (18 percent decrease). Parkville lost 246 units (13 percent decrease), and South Green lost 55 housing units (5 percent decrease). The changes in three neighborhoods account for three-quarters of the total drop in the citywide population, and may be partially explained by these declines in housing units.
As of the 2020 Census, housing vacancy rates were highest in South Green (20 percent) and lowest in Southwest Hartford and Blue Hills (6 percent each). Local-level housing vacancy rates can shift due to a range of factors including renovations and the leasing up of newly-constructed apartment buildings. For example, the long-term plan to demolish Bowles Park and reconstruct housing in Blue Hills may have contributed to large fluctuations in vacancy rate in that area.
As the Census Bureau releases even more detailed information in the coming months, DataHaven and other researchers will develop a deeper understanding of the reasons behind the changes noted here. These data are instrumental for our democracy—not only for creating representative voting districts and guiding the distribution of billions of dollars in federal funding, but also for planning education, housing, and health services and ensuring equitable investment in all of our communities.