
New Haven
Data Resources
Key Facts
| Title | New Haven 2015-2024 | Connecticut 2015-2024 |
|---|---|---|
|
% of adults, Satisfied with area where they live
|
79%
|
84%
|
|
% of adults, Trust neighbors
|
66%
|
84%
|
|
% of adults, Area is good place to raise kids
|
44%
|
73%
|
|
% of adults, Local parks in good condition
|
53%
|
75%
|
|
% of adults, Stores, etc. in walking distance
|
78%
|
57%
|
|
% of adults, Safe places to bike
|
73%
|
65%
|
|
% of adults, Feel safe to walk at night in their neighborhood
|
48%
|
69%
|
|
% of adults, In excellent or very good health
|
53%
|
57%
|
|
% of adults, Satisfied with life
|
58%
|
66%
|
|
% of adults, Bothered by anxiety
|
17%
|
13%
|
|
% of adults, Get social / emotional support
|
63%
|
68%
|
|
Food Insecurity Rate
|
24%
|
16%
|
|
Housing Insecurity Rate
|
12%
|
10%
|
|
Transportation Insecurity Rate
|
22%
|
14%
|
|
Maximum MoE on above estimates: +/- 4% for New Haven; +/- 1% for CT statewide
|
||
| Title |
New Haven 2023 5-year |
Error |
Connecticut 2023 5-year |
Error |
|---|---|---|---|---|
|
Total Population
|
132,893
|
+/-
76
|
3,598,348
|
+/-
0
|
|
Population Ages 0-17
|
28,710
|
+/-
1,401
|
733,998
|
+/-
4,336
|
|
% of Total Population, Ages 0-17
|
22%
|
+/-
1%
|
20%
|
+/-
0%
|
|
Population Ages 65+
|
15,578
|
+/-
1,020
|
650,772
|
+/-
5,064
|
|
% of Total Population, Ages 65+
|
12%
|
+/-
1%
|
18%
|
+/-
0%
|
|
Population Female
|
69,378
|
+/-
1,304
|
1,833,231
|
+/-
367
|
|
% of Total Population, Female
|
52%
|
+/-
1%
|
51%
|
+/-
0%
|
| Title |
New Haven 2023 5-year |
Error |
Connecticut 2023 5-year |
Error |
|---|---|---|---|---|
|
Latino Population
|
41,503
|
+/-
1,941
|
640,668
|
+/-
0
|
|
% of Total Population, Latino
|
31%
|
+/-
2%
|
18%
|
+/-
0%
|
|
White Non-Hispanic Population
|
38,974
|
+/-
1,879
|
2,265,780
|
+/-
3,030
|
|
% of Total Population, White Non-Hispanic
|
29%
|
+/-
1%
|
63%
|
+/-
0%
|
|
Black Non-Hispanic Population
|
38,597
|
+/-
1,862
|
355,413
|
+/-
2,943
|
|
% of Total Population, Black Non-Hispanic
|
29%
|
+/-
1%
|
10%
|
+/-
0%
|
|
Other Race Non-Hispanic Population
|
13,819
|
+/-
1,292
|
336,487
|
+/-
4,560
|
|
% of Total Population, Other Race Non-Hispanic
|
10%
|
+/-
1%
|
9%
|
+/-
0%
|
| Title |
New Haven 2023 5-year |
Error |
Connecticut 2023 5-year |
Error |
|---|---|---|---|---|
|
Foreign-born Population
|
23,526
|
+/-
1,744
|
555,161
|
+/-
8,104
|
|
% of Total Population, Foreign-born
|
18%
|
+/-
1%
|
15%
|
+/-
0%
|
| Title |
New Haven 2023 5-year |
Error |
Connecticut 2023 5-year |
Error |
|---|---|---|---|---|
|
Total Households
|
53,424
|
+/-
1,156
|
1,420,170
|
+/-
3,490
|
|
Owner-Occupied Households
|
15,157
|
+/-
885
|
939,912
|
+/-
5,867
|
|
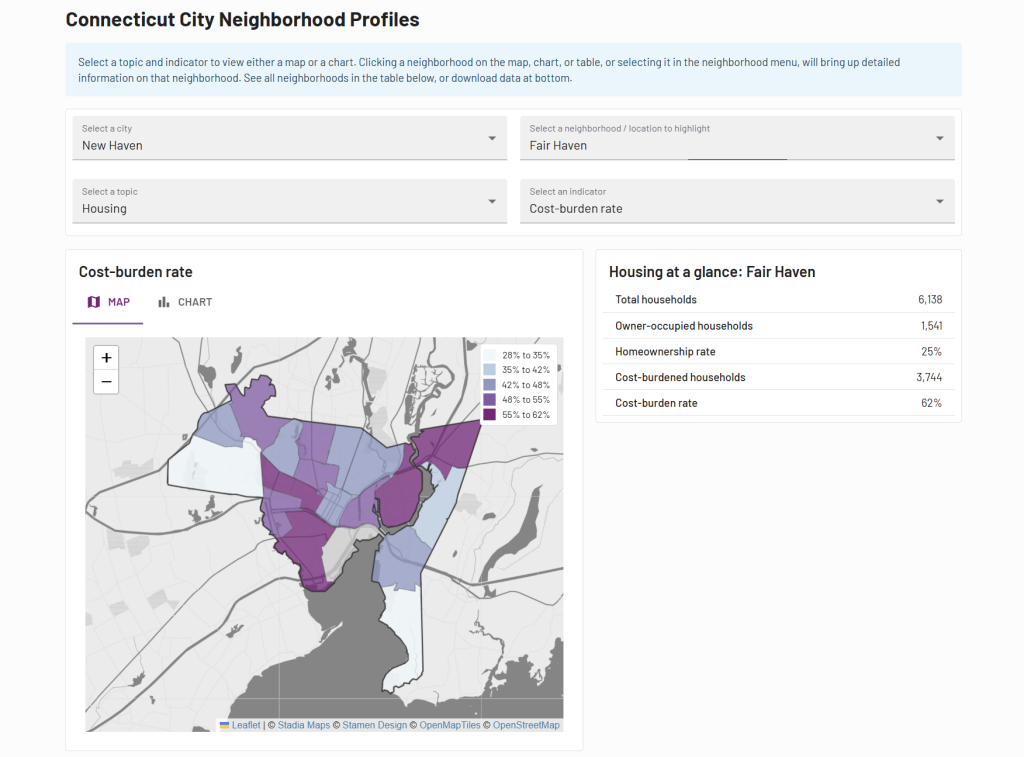
Homeownership Rate
|
28%
|
+/-
2%
|
66%
|
+/-
0%
|
|
Cost-Burdened Households
|
25,205
|
+/-
1,382
|
479,072
|
+/-
5,993
|
|
% of Households, Cost-Burdened
|
49%
|
+/-
2%
|
35%
|
+/-
0%
|
|
Households with a car
|
39,799
|
+/-
1,591
|
1,298,057
|
+/-
7,878
|
|
% of Households, with a car
|
74%
|
+/-
2%
|
91%
|
+/-
0%
|
| Title |
New Haven 2023 5-year |
Error |
Connecticut 2023 5-year |
Error |
|---|---|---|---|---|
|
Population Ages 25+
|
84,441
|
+/-
1,500
|
2,532,853
|
+/-
342
|
|
Ages 25+ without a high school diploma
|
11,853
|
+/-
1,088
|
219,549
|
+/-
4,597
|
|
% of Population Ages 25+, without a high school diploma
|
14%
|
+/-
1%
|
9%
|
+/-
0%
|
|
Ages 25+ with a Bachelor's degree or more
|
31,866
|
+/-
1,738
|
1,062,403
|
+/-
8,599
|
|
% of Population Ages 25+, with a Bachelor's degree or more
|
38%
|
+/-
2%
|
42%
|
+/-
0%
|
| Title |
New Haven 2023 5-year |
Error |
Connecticut 2023 5-year |
Error |
|---|---|---|---|---|
|
Median Household Income
|
53,771
|
+/-
4,369
|
93,760
|
+/-
669
|
| Title |
New Haven 2023 5-year |
Error |
Connecticut 2023 5-year |
Error |
|---|---|---|---|---|
|
Total Population, Poverty Status Determined
|
125,166
|
+/-
4,320
|
3,510,193
|
+/-
17,103
|
|
Population in Poverty
|
31,269
|
+/-
2,543
|
351,948
|
+/-
8,796
|
|
Poverty Rate
|
25%
|
+/-
2%
|
10%
|
+/-
0%
|
|
Population Low-Income
|
58,011
|
+/-
3,521
|
775,737
|
+/-
13,220
|
|
Low-Income Rate
|
46%
|
+/-
2%
|
22%
|
+/-
0%
|
| Title |
New Haven 2023 5-year |
Error |
Connecticut 2023 5-year |
Error |
|---|---|---|---|---|
|
Population Ages 0-17, Poverty Status Determined
|
28,075
|
+/-
1,966
|
724,622
|
+/-
8,134
|
|
Population Ages 0-17 In Poverty
|
10,060
|
+/-
1,268
|
95,177
|
+/-
3,539
|
|
Population Ages 0-17, Poverty Rate
|
36%
|
+/-
4%
|
13%
|
+/-
0%
|
|
Population Ages 0-17 Low-Income
|
17,732
|
+/-
1,651
|
204,747
|
+/-
5,137
|
|
Population Ages 0-17, Low-Income Rate
|
63%
|
+/-
4%
|
28%
|
+/-
1%
|
| Title |
New Haven 2023 5-year |
Error |
Connecticut 2023 5-year |
Error |
|---|---|---|---|---|
|
Population Ages 65+, Poverty Status Determined
|
15,195
|
+/-
1,147
|
633,062
|
+/-
5,939
|
|
Population Ages 65+ In Poverty
|
2,895
|
+/-
500
|
52,355
|
+/-
1,898
|
|
Population Ages 65+ Poverty Rate
|
19%
|
+/-
3%
|
8%
|
+/-
0%
|
|
Population Ages 65+ Low-Income
|
6,993
|
+/-
825
|
139,185
|
+/-
3,268
|
|
Population Ages 65+, Low-Income Rate
|
46%
|
+/-
4%
|
22%
|
+/-
0%
|
Source
Community Well-being data are from the 2015-2024 DataHaven Community Wellbeing Survey. See definitions below for more information. All other data are from the US Census Bureau ACS 5-year estimate. The ACS surveys a sample of households on a rolling monthly basis; survey data are aggregated and averaged into 1 and 5-year period estimates. The Census Bureau considers the 5-year estimates to be the most accurate and recommends using 5-year estimates for town-level data.