
All DataHaven Programs, Civic Vitality, Community Wellbeing Survey, Demographics, Economy, Education, Health, Housing, Public Safety
Data Reveals Hidden Concerns Amid Upturn
Originally published in the New Haven Independent on 4/12/19: https://www.newhavenindependent.org/index.php/archives/entry/data_haven_survey/
by APARNA NATHAN & MARK ABRAHAM
New Haven is a magnet for development these days. Apartment buildings and hotels rise downtown, and old buildings are renovated into new housing. The rate of violent crime is dropping, and over the past three months alone, over $50 million in venture capital flowed into local companies, representing more than half of the statewide total.
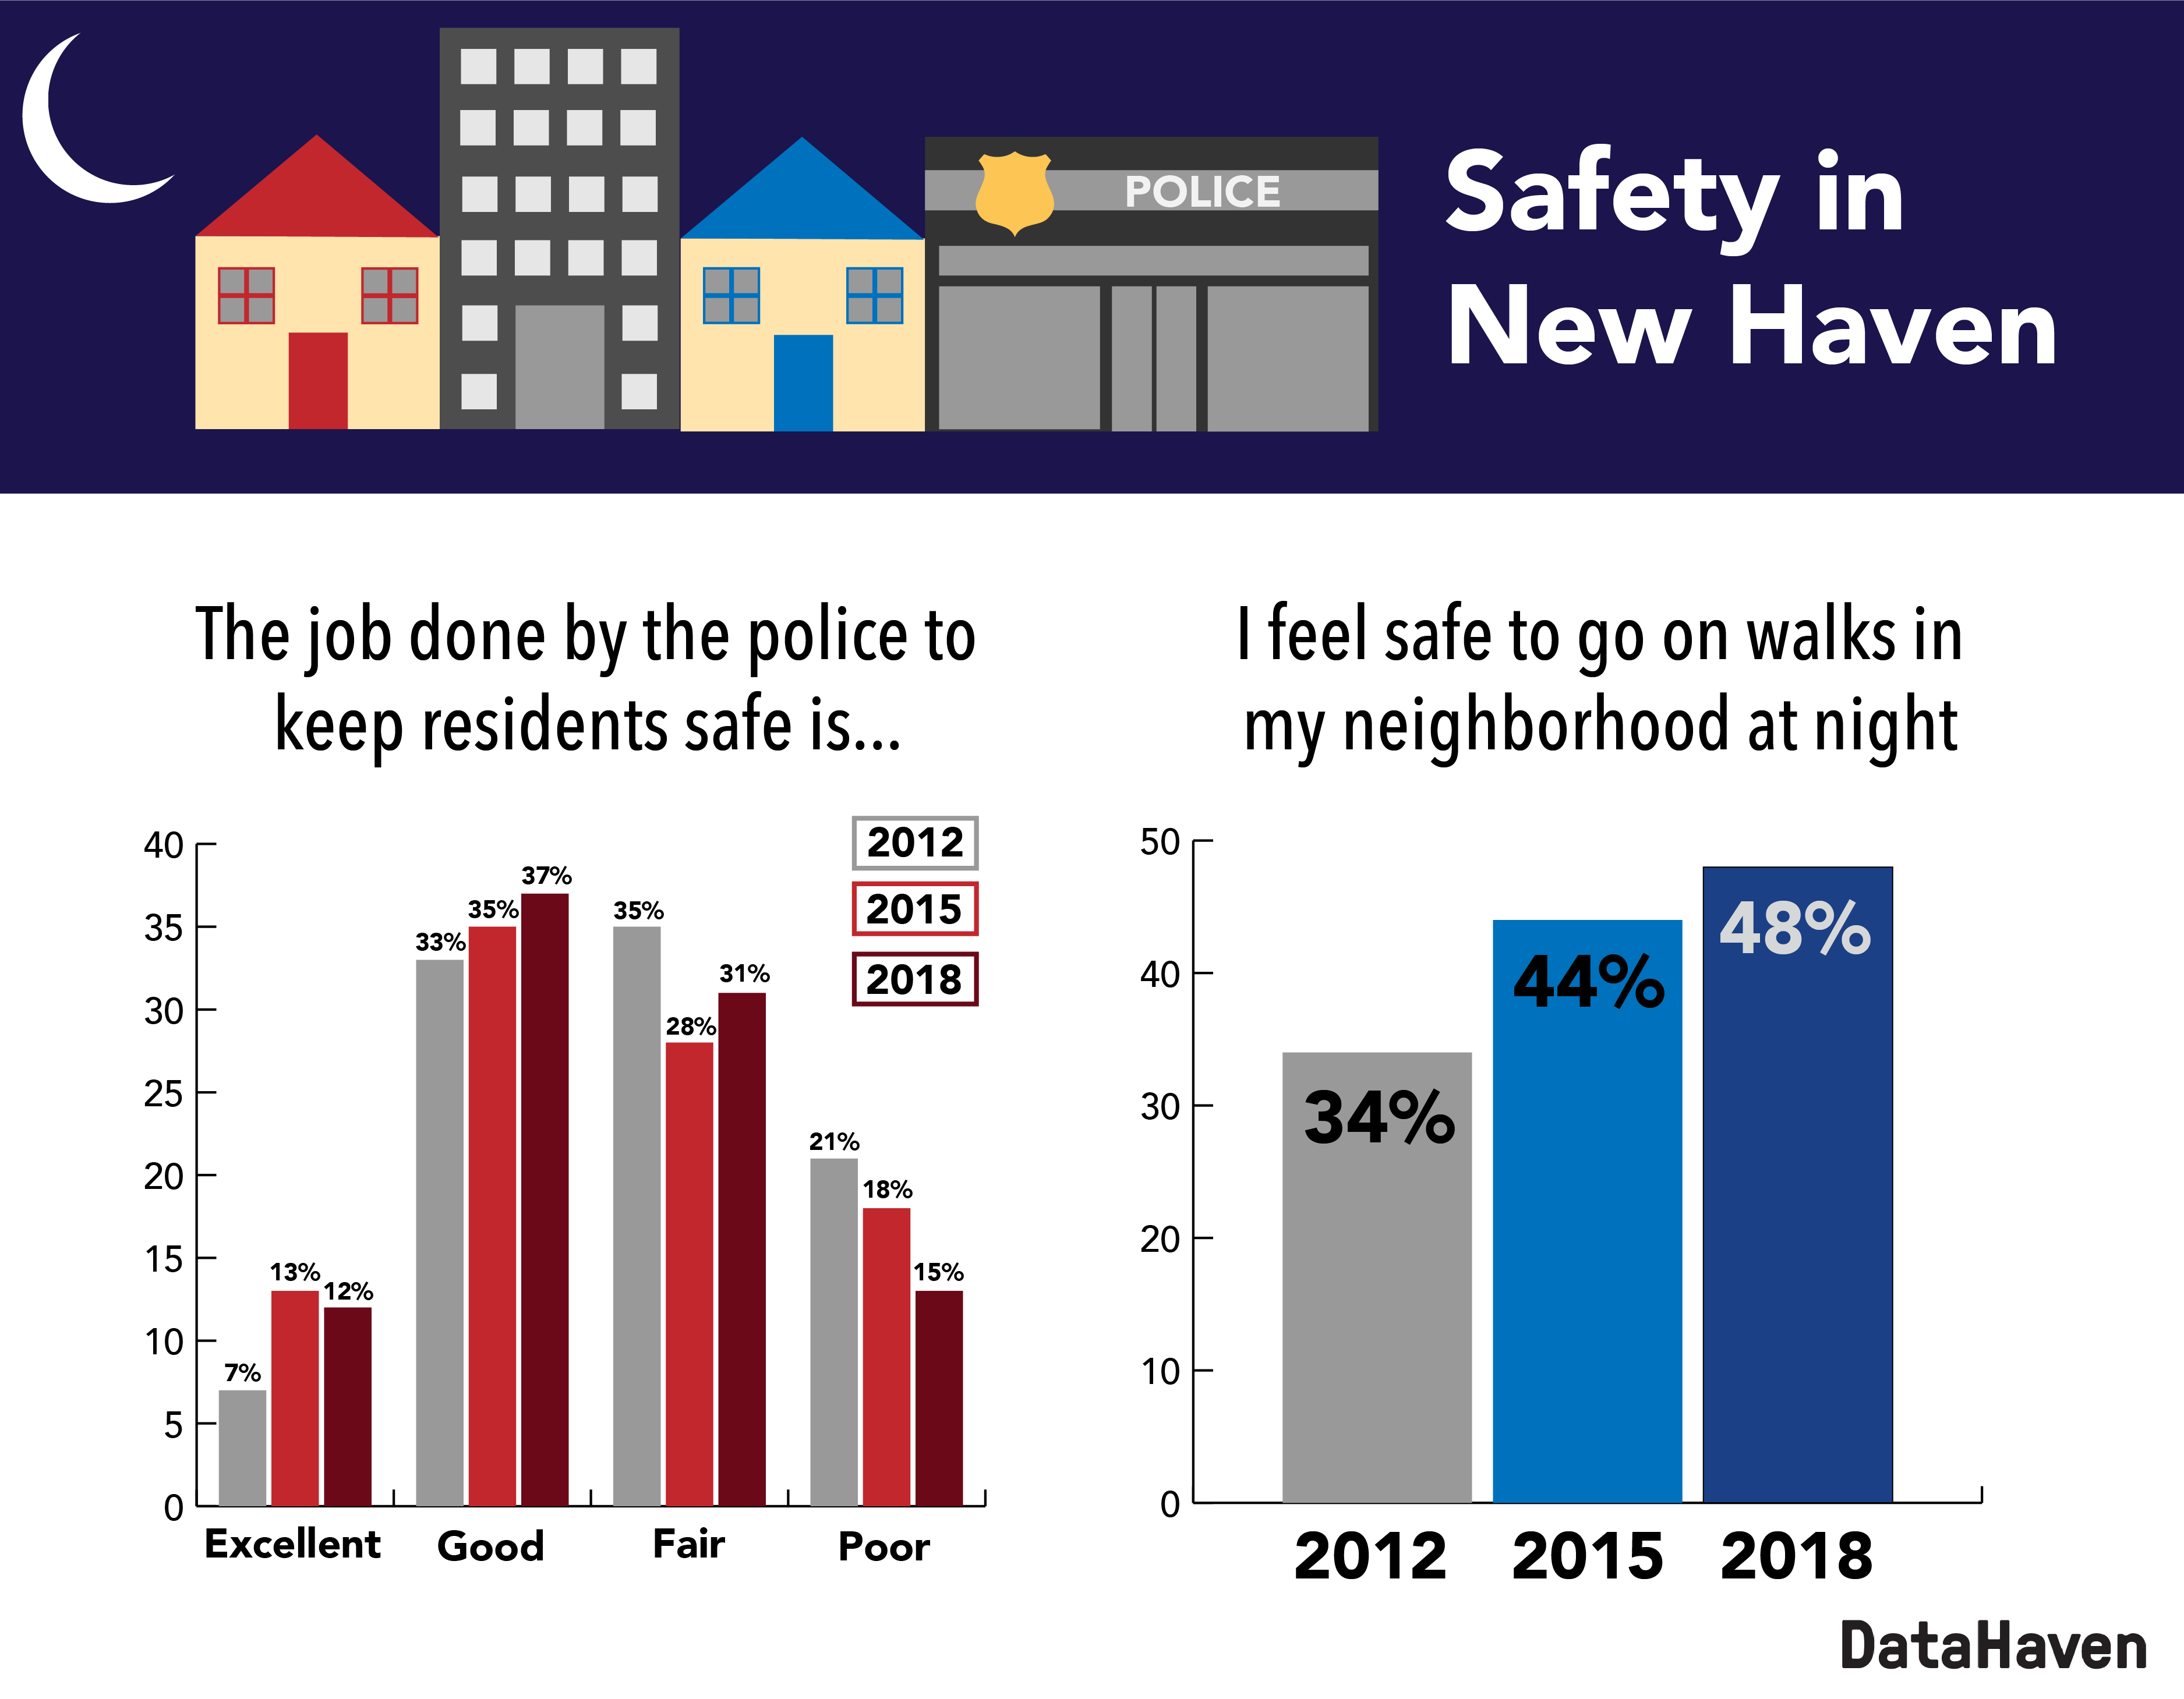
But the views of New Haveners over the past three years are more mixed. While residents feel safer and give higher marks to the police department than they did three years ago, in other ways, life in the Elm City is getting tougher: Money is increasingly tight, health disparities persist, and adults are growing more anxious.
These are just a few of the findings of the 2018 DataHaven Community Wellbeing Survey, a major statewide undertaking that asked 16,043 randomly-selected adults throughout Connecticut, including 1,001 city residents, in-depth questions about their employment, health, neighborhood safety, and overall life satisfaction between March and December 2018. As with other large public surveys, responses are statistically weighted to ensure they are representative of the total adult population. Combined with the first two iterations of the survey in 2012 and 2015, the data capture some less positive trends that in many ways mirror statewide shifts. But New Haven residents also recognize that their city is steadily improving — a quality that makes the city stand apart from the rest of the state.
Jobs and Finances
Of the 70,000 potential workers in New Haven – i.e., those adults who don’t identify as retired, full-time students, disabled, or homemakers – we estimate that 20,000 (28 percent) were “under-employed” at any given point in time in 2018. Based on our live, in-depth interviews, this means that they didn’t have a paid job and would like one, or that they were working part-time but said they would prefer to have a full-time job.
That’s a much higher figure than the official unemployment measure, which considered just 3,300 city adults (5.1 percent) to be unemployed in 2018. The official unemployment rate is based on a state model that estimates how many potential New Haven workers are willing and available to work, have actively looked for a job during the past few weeks, don’t have any temporary or part-time job at all, and meet other criteria. The DataHaven measure may provide a more realistic picture of employment.
Not surprisingly, financial stress remains a concern among many families. In New Haven, 59 percent of adults say they are “living comfortably” or “doing alright” financially (up from 49 percent in 2012, but unchanged since 2015). But 25 percent are still “just getting by,” and 16 percent say they are finding it difficult or very difficult to manage.
Compared to 2015, there are significantly more adults in New Haven who say they do not have at least two months of savings to rely on in the event they lose their regular source of income. The struggle to find enough money to pay bills can translate to food insecurity: 21 percent (21,000 city adults) – including 27 percent of adults who identify as African-American and 41 percent who identify as Latino or Hispanic – said there was a point last year when they couldn’t feed their family. This overall number was similar to what we measured in 2015, but a larger share of the people experiencing food insecurity — 30 percent (6,000 city adults) — reported being unable to afford food almost every month.
Additionally, 21 percent of New Haveners stayed home at least once during the past year because they couldn’t get around, and 8 percent (8,000 city adults) said that the lack of reliable transportation caused them to miss a doctor’s appointment. This represents a greater share than the 5 percent of adults statewide who reported missing such appointments.
One in 10 adults in New Haven said there was a point in the last year when they didn’t have enough money to house their family, and many renters experienced formal or informal evictions or had landlords that didn’t fix the problems they reported in their apartment.
Health Disparities
While some health care access gaps closed, other disparities widened. A rising number of adults in New Haven have reported obtaining health insurance, yet there are still thousands who say they had to avoid health care last year due to its cost.
Smoking rates have been falling statewide, but not as much in New Haven: 19,000 city adults smoke cigarettes (19 percent, versus 14 percent statewide), while in the past 30 days, there were also 18,000 adults (18 percent) who used marijuana or cannabis and 13,000 (13 percent) who used e-cigarettes. The percentage of city adults with body mass indexes classified as obese (31 percent) remained roughly constant across the full survey results, but increased in a subset of demographics, including people with incomes below $30,000 and people without a college education.
These citywide averages can mask the fact that many of the other burdens measured by the survey – such as diabetes, depression, asthma, discrimination experiences, and limited access to food – tend to fall heavily within lower-income neighborhoods. More detailed findings and strategies to improve health will be discussed at an upcoming community forum sponsored by Yale-New Haven Hospital on Tuesday, April 23, 2019 from 5 to 7 p.m. at the Wilson Branch Library at 303 Washington Avenue.
Adding It Up
The DataHaven survey seeks to inform policy by measuring happiness and well-being more democratically, seeing that common statistics such as household income, homeownership, and unemployment do not provide a full picture of how well we are doing as a community. Well-being and sources of stress are closely interrelated, and all in all, New Haveners are somewhat less happy and more anxious than they were three years ago. In 2015, 67 percent of residents said they were at least mostly happy the previous day; this year, that number dipped to 60 percent. The percentage of adults who said they were anxious the previous day jumped from 50 percent to 60 percent.
This trend was consistent across almost all demographics, affecting low-income and high-income city residents alike: Reported anxiety increased from 55 percent to 67 percent in people making less than $30,000 per year, and from 44 percent to 64 percent in people making more than $75,000 per year.
Looking at life satisfaction more broadly, only 21 percent of New Haveners reported being “completely” satisfied with their lives, compared to 30 percent in 2015. This decline was especially apparent in people between the ages of 35 and 49 (“complete” life satisfaction decreased from 32 percent in 2015 to 13 percent in 2018) and Hispanic individuals (complete life satisfaction decreased from 35 percent in 2015 to 21 percent in 2018). This mirrors trends observed across Connecticut as a whole.
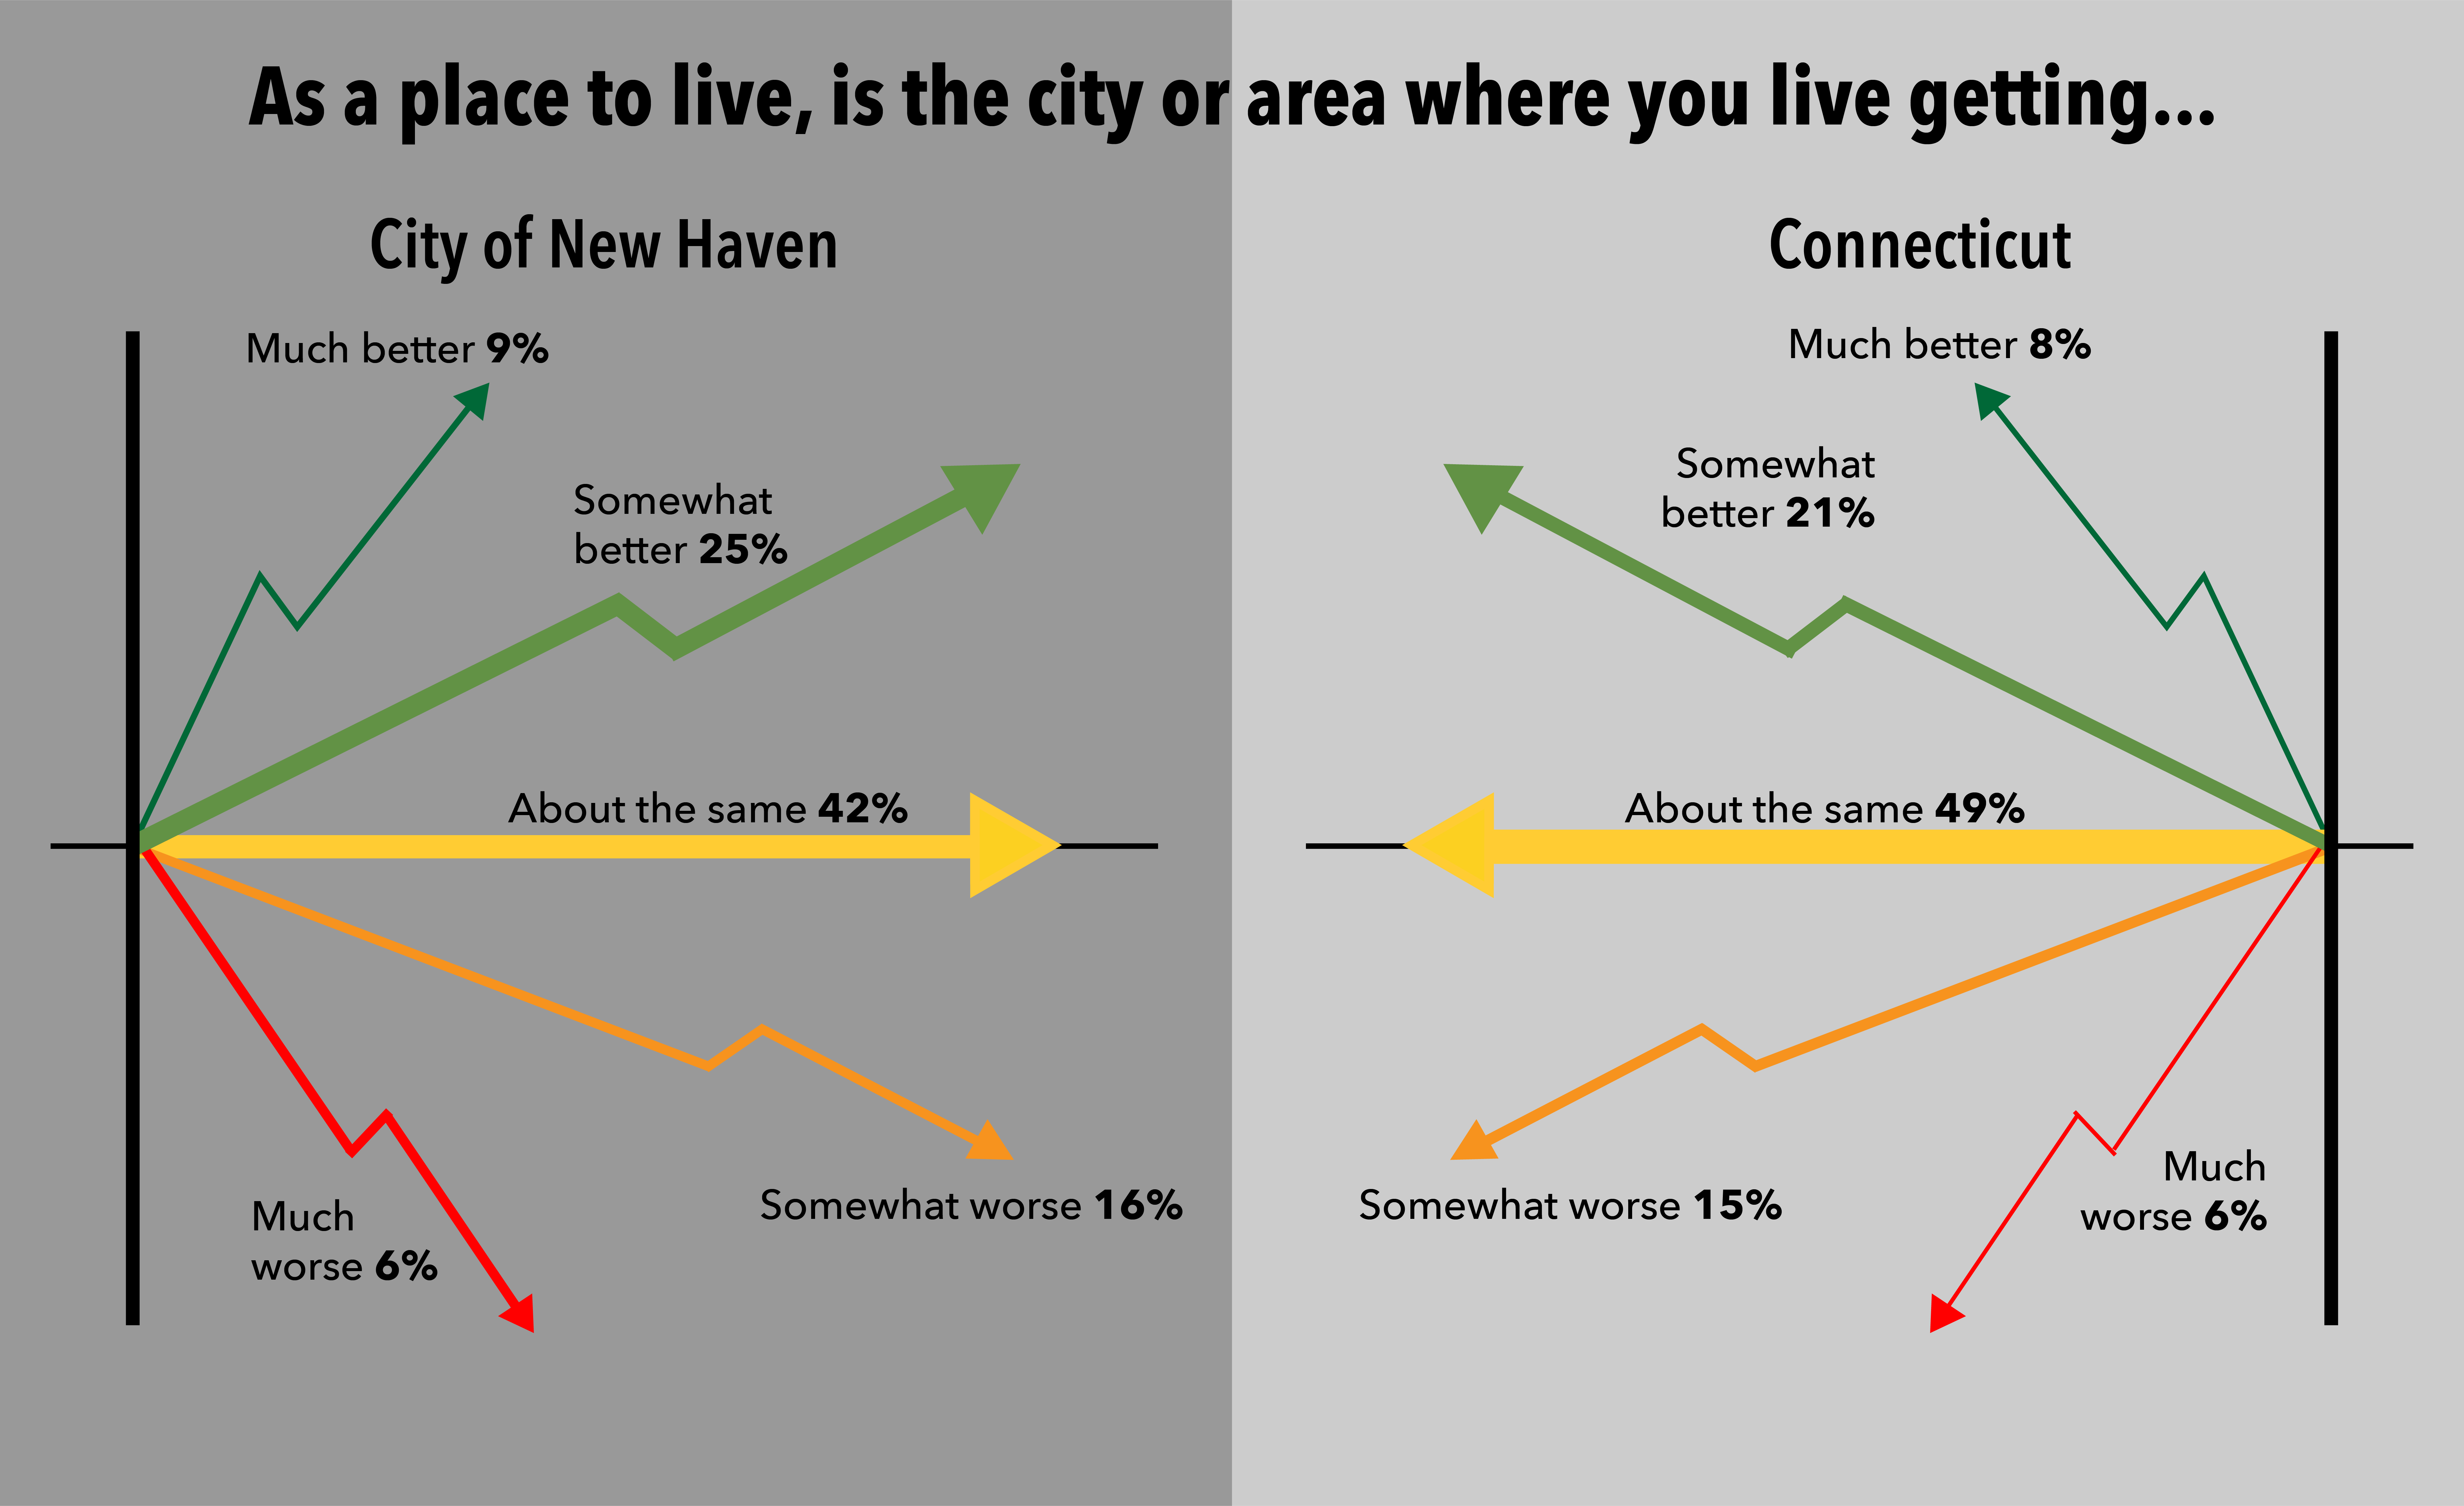
But New Haveners were generally positive about the neighborhood in which they live. Nearly three quarters of residents are satisfied with the neighborhoods where they live, and 34 percent say the city is improving overall (compared to 29 percent of people across the state).
Compared to 2015, people also felt significantly more confident about the ability of residents in their neighborhood to find a job (even if they are far less confident than their suburban neighbors that those available jobs will present opportunities for advancement), and they are more positive about the quality of New Haven as a place to raise children. They responded positively about cultural resources and outdoor spaces near their home, like stores, sidewalks, and bike lanes: 74 percent of adults in New Haven now agree there are safe places to ride a bicycle in their neighborhood, which is 12 percentage points above the statewide average.
Three years ago, one of the most notable survey trends was an increased feeling of safety: 44 percent of all New Haven adults in 2015 reported feeling safe to go on walks in their neighborhood at night, an increase from the 34 percent of adults who felt safe doing so in 2012. In 2018, that number climbed to 48 percent — an improvement, though still significantly lower than the 69 percent of Connecticut residents who feel safe doing the same.
And in the face of whatever adversity may come their way, people feel supported in their communities. In 2018, 82 percent of New Haveners said they usually or sometimes get the social and emotional support they need, and 70 percent (71,000 adults) agree with the statement that “people in this neighborhood are involved in trying to improve the neighborhood.” This is similar to the statewide average, and significantly higher than the 60 percent of adults in Connecticut’s other large cities, who agree with that statement. As pressures rise, New Haveners are helping each other out.
To learn more about the trends that matter to you, check out the data from the 2018 DataHaven Community Wellbeing Survey here. Aparna Nathan is Research Assistant and Mark Abraham is Executive Director at DataHaven, a formal partner of the National Neighborhood Indicators Partnership with a 25-year history of public service to Greater New Haven and Connecticut. DataHaven’s mission is to improve quality of life by collecting, sharing and interpreting public data for effective decision making.