Concentrated Wealth and Poverty in Connecticut’s Neighborhoods
Analyzing racially-concentrated economic inequality in Connecticut
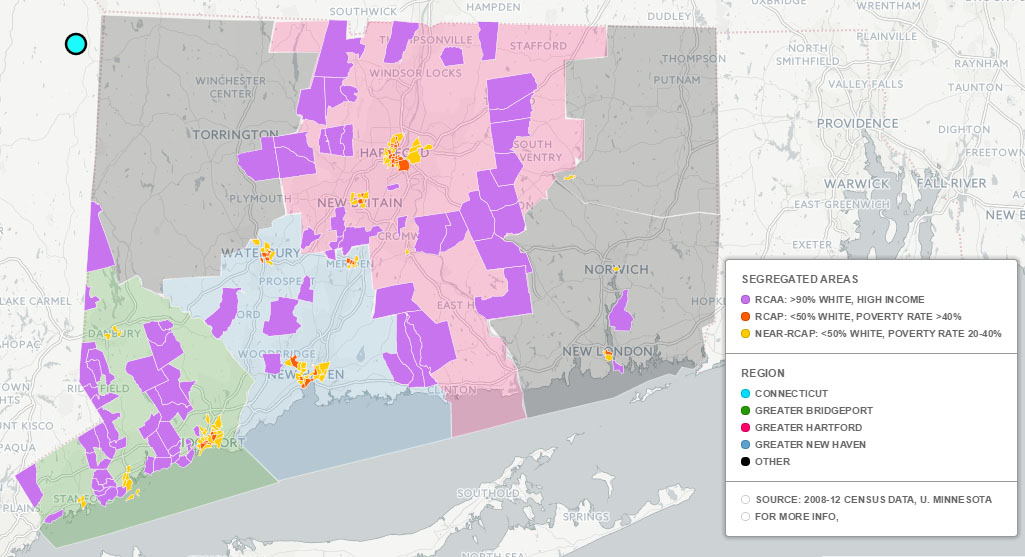
[Note: The interactive map that was on this page is no longer active. Please view our Community Index Reports and Data Dashboard for more recent maps]
Wealth and poverty are highly concentrated in Connecticut — more so than in many other large metropolitan areas. And often, those neighborhoods are racially and economically segregated from each other.
For example, 27 percent of top-earning households live in neighborhoods that are predominantly white and wealthy. In other large metropolitan areas, it’s just 10 percent.
Poor residents in greater Hartford and greater New Haven are just as likely to live in an extremely poor, predominantly minority neighborhood as those in greater Detroit or greater Philadelphia.
And there are twice as many affluent — and segregated — neighborhoods in Connecticut as there are poor, segregated ones.
These are findings from a DataHaven study, for which we borrowed methodology from University of Minnesota researchers. They devised a new way of explaining rising neighborhood inequality (Damiano et al.), highlighting the relative isolation of affluent, white households in 15 major metropolitan areas throughout the United States. We conducted a similar analysis, looking at three metropolitan areas in Connecticut: Bridgeport (Fairfield County), New Haven (New Haven County) and Hartford (Hartford, Tolland and Middlesex counties).
While these three metropolitan areas are not always considered “large” by national standards, Connecticut as a whole is comparable to any large metropolitan area. The crescent-shaped, urban corridor that runs across Fairfield and New Haven counties and then northward to Hartford is larger in population and higher in density than the St. Louis; Portland, Ore; and Baltimore metropolitan areas.
Researchers and policymakers often focus on segregation of racial and ethnic minorities in certain neighborhoods and the disadvantages caused by concentrated poverty. But, in the U.S., those neighborhoods are not as common as the opposite: ones with an unusually large share of wealthy, white households — which are just as important to understand at a local level.
HOW DID WE FIND THESE SEGREGATED POOR AND RICH NEIGHBORHOODS?
The Minnesota researchers found concentrated affluence by looking for neighborhoods where at least 90 percent of the population is white and the median household income is at least four times the federal poverty line (adjusted using BEA data for local cost of living). These areas were called “racially concentrated areas of affluence” — or RCAAs.
They found concentrated poverty by looking for neighborhoods where less than 50 percent of the population is white and at least 40 percent of the population has a household income below the federal poverty line. They were called “racially concentrated areas of poverty” — or RCAPs.
BIGGER DIVIDES IN CONNECTICUT THAN NATIONWIDE
When they compared these two groups, they found that these wealthy, mostly white neighborhoods are more common in the U.S. than poor, mostly minority neighborhoods.
In Connecticut, we found that the divide was even starker.
- There are twice as many segregated, affluent neighborhoods — 80 Census Tracts, accounting for 10 percent of the state’s population — as there are segregated, extremely poor neighborhoods — 41 Census Tracts, accounting for 3 percent of the state’s population.
- In Greater Bridgeport (Fairfield County), with many wealthy New York City suburbs, there are nearly seven times more concentrated wealthy neighborhoods than poor ones.
We also created a third category of neighborhoods — called “near-RCAPs.” Like RCAPs, these are neighborhoods in which most residents do not identify themselves as white, but in which a slightly smaller fraction of the population (between 20 and 40 percent) has a household income below the federal poverty line. We created this designation because many studies have demonstrated that neighborhoods with a poverty rate of at least 20 percent are just as susceptible to the challenges of concentrated poverty as neighborhoods with at least a 40 percent poverty rate.
WORLDS APART
Segregated affluent and poor neighborhoods represent two extremes in Connecticut.
While the total population living in poverty is growing more rapidly in suburban areas than it is in cities, the spatial analysis reveals that disadvantaged, racially concentrated neighborhoods are still much more common within older urban centers than in suburbs. Wealthy, segregated neighborhoods are mostly found in suburban towns. Likewise, the rural northeast and northwest regions of the state are mostly devoid of neighborhoods with racially segregated wealth or poverty, at least when considered at the level of a Census Tract.
It’s rare that predominantly white, affluent neighborhoods directly border non-white, impoverished ones — a national trend described by The Atlantic’s City Lab blog, with several neighborhoods usually lying between these two types of neighborhoods. Only in a handful of locations — such Fairfield, Bridgeport and Norwalk — do they border. That said, these neighborhoods often exist in relatively close proximity, as many workers living in Connecticut’s poorer, urban neighborhoods commute to its more affluent suburban areas, which tend to have lower-paying jobs than urban centers, and vice versa.
COMPARING ‘CONCENTRATED AFFLUENCE’ IN CONNECTICUT TO OTHER LARGE METRO AREAS
Connecticut is a wealthy state with a relatively prosperous middle class, often ranking as the top state in the nation on various measures of health and median income. However, it also has among the nation’s highest levels of income inequality. Further gaps in income by race and ethnicity are well known, but the trends behind the uneven geographic distribution of income by neighborhood are less well-documented.
In Greater Bridgeport (Fairfield County) and Greater Hartford, the share of the population that lives in racially concentrated and affluent neighborhoods is higher than that of most other major cities examined in the Minnesota working paper. Statewide, 10 percent of all Connecticut residents live in racially concentrated, affluent areas; in the 15 large urban regions studied in the Minnesota paper, only an average of 3 percent of the population lives in those areas. These trends can be seen when comparing Connecticut regions to other cities:
Looking at the neighborhoods where the top-earning households are provides an additional measure of concentrated wealth.

CONCENTRATED POVERTY AND ‘DOUBLE JEOPARDY’
The study also shows that in Connecticut, a substantial share of the population is exposed to extremely high rates of neighborhood poverty. About 3 percent of Connecticut’s total population lives in these concentrated, poor neighborhoods — a rate that matches that of the University of Minnesota’s 15-region sample.

Another indication of concentrated regional poverty is the percentage of poor residents who live in a neighborhood of concentrated poverty. This is sometimes known as “double jeopardy,” because of strong evidence that exposure to multiple layers of disadvantage is more deleterious to health, child achievement and well-being than any single indicator of poverty.
Connecticut fares worse than most of the other large cities in the 15-region sample.
Statewide, 15 percent of Connecticut’s poor population lives in a racially concentrated, poor neighborhood. Poor residents of Connecticut’s neighborhoods face among the highest levels of segregation in the nation, similar to the experiences of those living in Greater Detroit and Philadelphia.

IMPLICATIONS AND CONCLUSION
These poor, racially concentrated areas are often the focus of social policy and urban research. But this means that policymakers may overlook the potential impacts of wealthy, segregated neighborhoods.
A high number of racially segregated, affluent neighborhoods “can inhibit the pursuit of region-wide remedies … [and] a sense of shared destiny within a metropolitan area,” writes University of Minnesota researcher Edward Goetz writes in The Atlantic.
The geographic concentration of wealth may direct resources to a small share of the population that lives there, which over time can further inequalities between rich and poor areas, says sociologist Douglas S Massey. “The social worlds of the rich and poor will diverge … [divorcing] the interests of the rich from the welfare of the poor.”
In regions where the wealthiest live separately from the poorest, social and financial resources may not be shared to solve regional issues, which can undermine the economic competitiveness of the entire region — like in Oakland County, Michigan, adjacent to Detroit.
In short, spatial divisions can compound economic or ethnic differences, and undermine efforts to improve the lives of populations that face historic and current disadvantages.
And in Connecticut, the evidence suggests residential segregation of families by income is rising more rapidly than elsewhere. A study by Reardon and Bischoff showed that the proportion of New Haven area families living in either “poor” or “affluent” neighborhoods rose from 6.4 percent in 1970 to 30.5 percent in 2007 — one of the most rapid increases of neighborhood income polarization in the country. An animated map by DataHaven shows the rise of neighborhood-level inequality since 1980.
According to Sarah Treuhaft of PolicyLink, strategies to address racially concentrated affluence and poverty include fair housing and zoning policies that prevent subsidies for new developments that perpetuate existing patterns of segregation, and targeted investments in community development, education, workforce development and transportation in segregated, poor areas to better connect people to economic opportunities.
Additionally, efforts to understand the disparities between neighborhoods in urban regions are crucial to dispel the “[erosion of] empathy” that results from concentrations of affluence and poverty.
Programs like our 2015 Community Wellbeing Survey — a collaborative effort of over 100 partners that will interview nearly 20,000 randomly-selected residents this year to create measures of economic and social well-being across statewide, regional, town, and neighborhood levels – can help identify where equity-driven approaches can make Connecticut a healthier and wealthier place for all residents to live.
Mary Buchanan is the Project Manager and Mark Abraham is the Executive Director of DataHaven, a formal partner of the National Neighborhood Indicators Partnership with a 25-year history of public service to Greater New Haven and Connecticut. DataHaven’s mission is to improve quality of life by compiling, sharing and interpreting public data for effective decision making.
Note: This report was originally posted at CTMirror’s TrendCT page. Some of the tables we include above were created by DataHaven but styled by TrendCT staff for that original post.