
About the Profiles
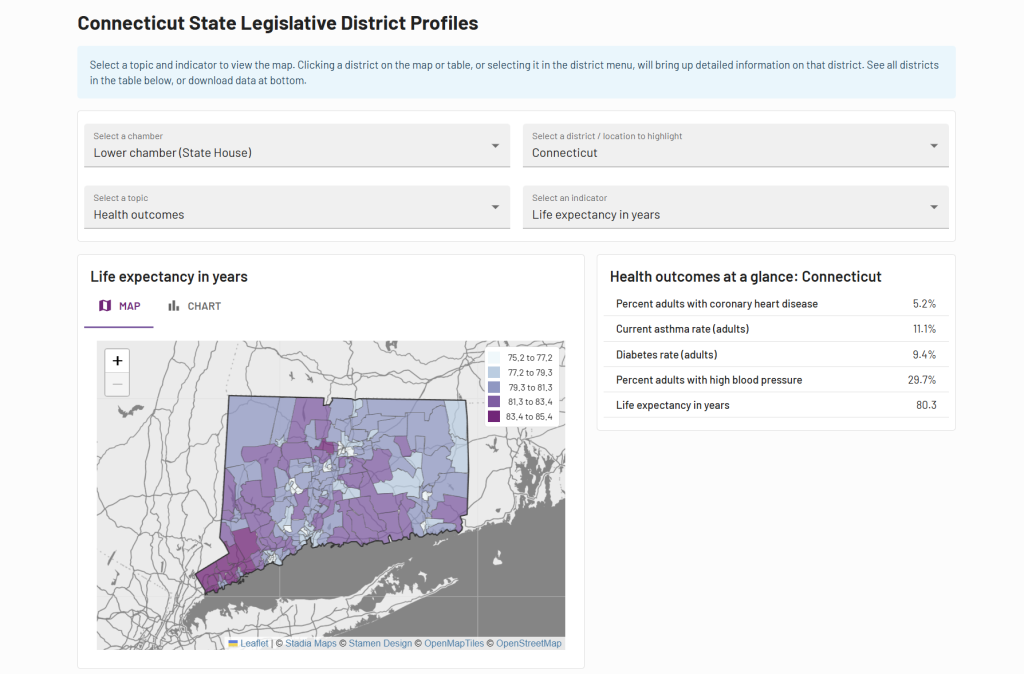
DataHaven has maintained neighborhood and community profiles and maps for over 30 years. The estimates in our Connecticut State Legislative District Profiles are based on Connecticut State House and Senate districts. Unlike many other online maps, the data visualization technology we use is highly responsive across mobile devices.
2024 Legislative District Profiles
Begin by selecting your legislative chamber (House or Senate). Click the map or use the dropdown menus to select your legislative district. Click “map” or “chart” to toggle between the interactive charts and statewide map. After viewing the visualization, click on the “X” in the top right to return to this page.
Links to download the raw data are embedded within the visualization itself (see links at bottom). Please contact us if you have any issues accessing these data files.
Other relevant resources
- To access town-level data for the entire state, we recommend accessing DataHaven’s Connecticut Town Data Viewer.
- DataHaven publishes data profiles for neighborhoods within Connecticut cities.
- A DataHaven report, 2020 Census Data: Demographic Change in Connecticut Town and City Neighborhoods, contains maps and analyses of changes since the 2010 Census, based on local results from the 2020 Census that were first released in August 2021.
- DataHaven’s Connecticut Town Equity Reports contain local maps for all 169 towns in the state.
- DataHaven publishes analyses of the local-level impacts of policies such as a proposed Child Tax Credit, cuts to healthcare and food assistance, and tax effects of legislation, typically at the town and/or legislative district level. These are posted on the main reports page of our website.
Previous editions
View the 2020 edition of the profiles by clicking here.
View the 2019 edition of the profiles by clicking here.
More information
Please contact us with any questions. Data for other Connecticut communities, towns, and areas are posted on our community profile page, in our Town Equity Reports, and elsewhere on this website.
About the Profiles
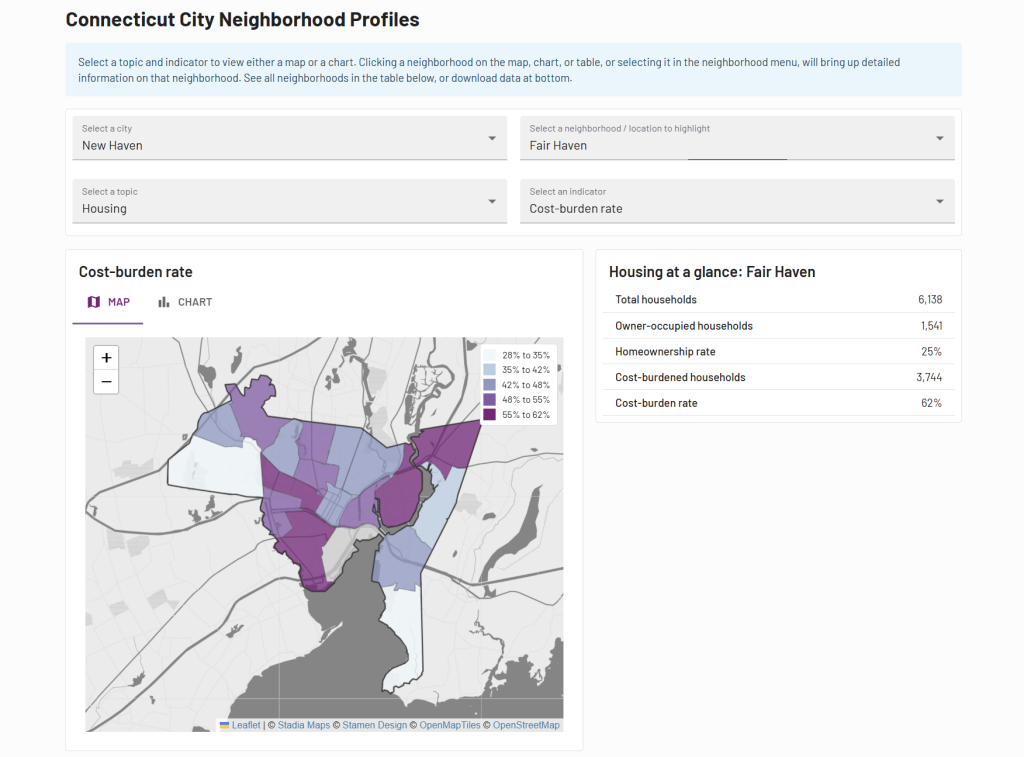
DataHaven has collected data for neighborhoods throughout Connecticut for over 30 years. The estimates in our Connecticut City Neighborhood Profiles are developed based on locally-designated neighborhoods within the cities of Bridgeport, New Haven, Hartford-West Hartford, and Stamford (neighborhood-level data for other cities and towns can be added in the future based on requests). Unlike many other online maps, the data visualization technology we use is highly responsive across mobile devices.
2024 City Neighborhood Profiles
View the 2024 edition of the neighborhood profiles by clicking here.
Begin by selecting your city. Click on “chart” or “map” to toggle between charts and maps of each city. After viewing the visualization, click on the “X” in the top right to return to this page.
Links to download the raw data are embedded within the visualization itself (see links at bottom). Please contact us if you have any issues accessing these data files.
Other relevant resources
- To access town-level data for the entire state, we recommend accessing DataHaven’s Connecticut Town Data Viewer.
- DataHaven publishes data profiles for Connecticut State House and State Senate districts.
- A DataHaven report, 2020 Census Data: Demographic Change in Connecticut Town and City Neighborhoods, contains maps and analyses of changes since the 2010 Census, based on local results from the 2020 Census that were first released in August 2021.
- DataHaven’s Connecticut Town Equity Reports contain local maps for all 169 towns in the state.
Prior versions
View the 2020 edition of the profiles by clicking here.
View the 2019 edition of the profiles by clicking here.
More Information
Please contact us with any questions. Data for other Connecticut communities, towns, and areas are posted on our community profile page, in our Town Equity Reports, and elsewhere on this website.
MRP estimates using DataHaven Community Wellbeing Survey pooled data.
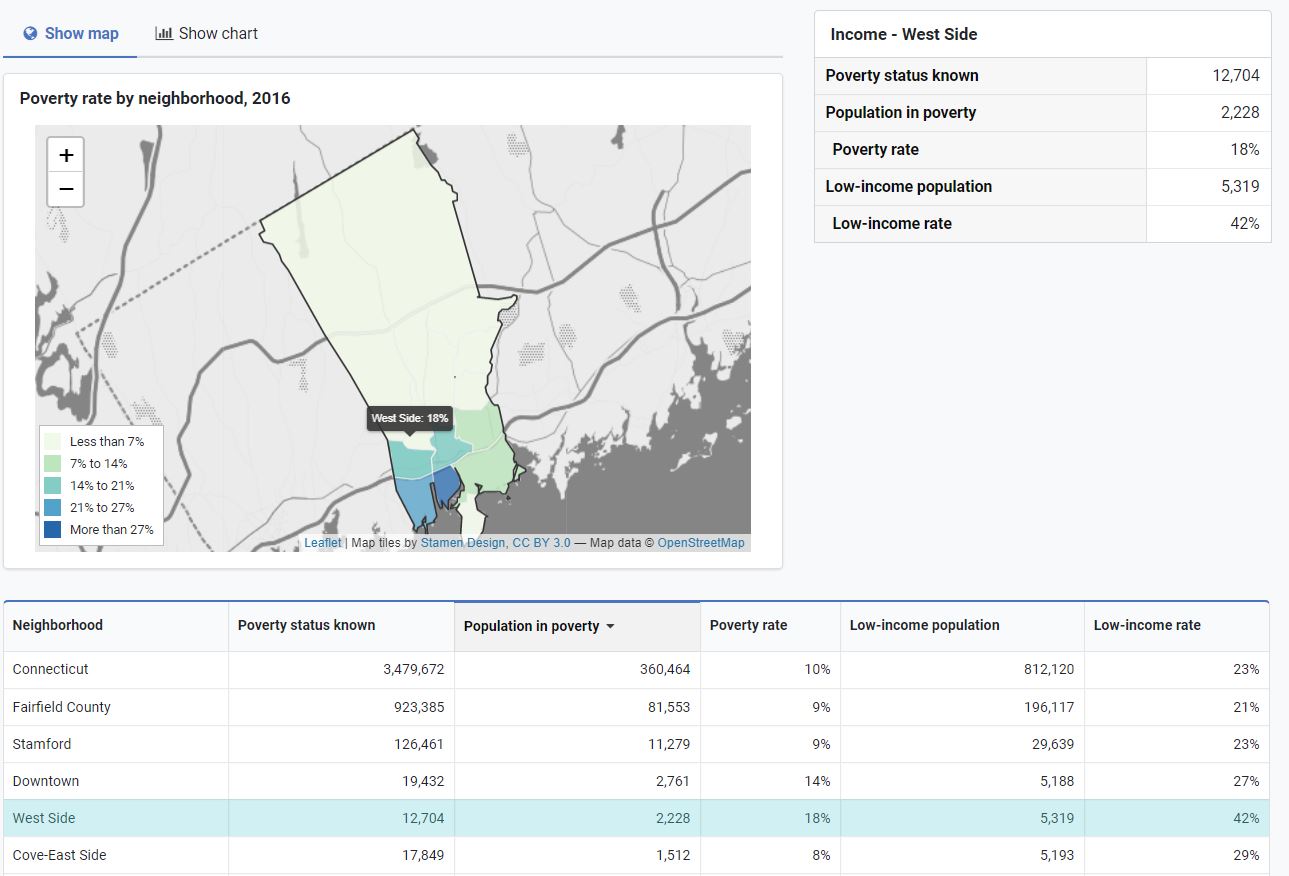
Our updated Stamford neighborhood data visualization is now posted within our Connecticut City Neighborhood Profiles.
The older version may be found below:
Stamford Neighborhood Profiles (Published 2018)
With support from public and private partners, DataHaven has maintained neighborhood profiles and maps for over 10 years. We have updated our maps and profiles with census data released in December 2017, and with new data visualization technology that is responsive to various devices.
View the 2016 profiles by clicking here.
After viewing the visualization, click on the “X” in the top right to return to this page.
Please contact us with any questions. Updated PDF documents for any current year have significant additional detail, and are also available upon request. Raw data downloads are also embedded within the visualization above.
Please contact DataHaven for more information or to request a more detailed analysis.
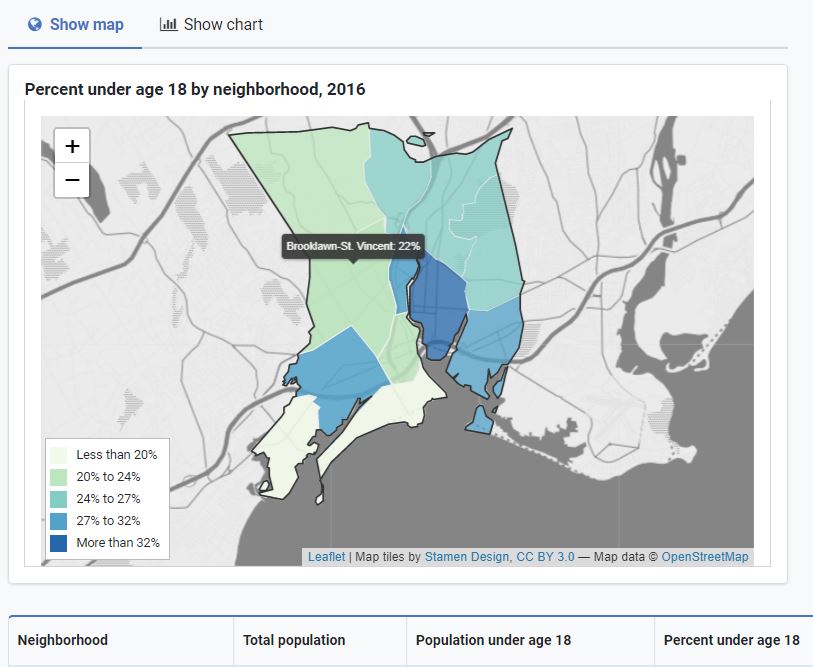
Our updated Bridgeport neighborhood data visualization is now posted within our Connecticut City Neighborhood Profiles.
The older version may be found below:
2016 Bridgeport Neighborhood Profiles (Published 2018)
With support from public and private partners, DataHaven has maintained neighborhood profiles and maps for over 10 years. We have updated our maps and profiles with census data released in December 2017, and with new data visualization technology that is responsive to various devices.
View the 2016 profiles by clicking here.
After viewing the visualization, click on the “X” in the top right to return to this page.
Please contact us with any questions. Updated PDF documents for any current year have significant additional detail, and are also available upon request. Raw data downloads are also embedded within the visualization above.
Please contact DataHaven for more information or to request a more detailed analysis.
Our updated New Haven neighborhood data visualization is now posted within our Connecticut City Neighborhood Profiles.
The older version may be found below:
New Haven Neighborhood Profiles (Published 2018)
With support from public and private partners, DataHaven has maintained neighborhood profiles and maps for over 10 years. We have updated our maps and profiles with census data released in December 2017, and with new data visualization technology that is responsive to various devices.
View the 2016 profiles by clicking here.
After viewing the visualization, click on the “X” in the top right to return to this page.
Please contact us with any questions. Updated PDF documents for any current year have significant additional detail, and are also available upon request. Raw data downloads are also embedded within the visualization above.

Extended Versions
Click on the “Document” link below to access a current version of our PDF neighborhood estimates, which contain many additional indicators. You may also download some of our earlier posted versions (2014) here, and (2010) here. Please contact DataHaven for more information or to request a more detailed analysis.
Notes
The estimates in the neighborhood profiles are derived from Census 5-year American Community Survey data (the latest available as of the publication date), and are only available at a neighborhood level through DataHaven.
In partnership with DataHaven, neighborhood boundaries were updated by the City of New Haven City Plan Department for the purposes of developing the city’s comprehensive plan in 2012, and do not correspond exactly to Census Tracts or Block Groups in all cases. Because of improvements in how we obtain Census data for small areas, some data elements in our 2014 neighborhood profiles are not directly comparable to those used in our 2010 neighborhood profiles. Please note that there are no estimates for Long Wharf because the area is considered to be a commercial area with zero population. There are a dozen or so residents living along the boundary line with the Hill neighborhood, and they are automatically added to the Hill neighborhood estimate. Census Tract and neighborhood-level data from the American Community Survey are subject to high margins of error. Please compare and use with great caution. Please contact DataHaven for additional information.
Our updated Hartford-West Hartford neighborhood data visualization is now posted within our Connecticut City Neighborhood Profiles.
The older version may be found below:
Hartford-West Hartford Neighborhood Profiles (Published 2018)
With support from public and private partners, DataHaven has maintained neighborhood profiles and maps for over 10 years. We have updated our maps and profiles with census data released in December 2017, and with new data visualization technology that is responsive to various devices.
View the 2016 profiles by clicking here.
After viewing the visualization, click on the “X” in the top right to return to this page.
Please contact us with any questions. Updated PDF documents for any current year have significant additional detail, and are also available upon request. Raw data downloads are also embedded within the visualization above.

Extended Versions
Click on the “Document” link below to access a current version of our PDF neighborhood estimates, which contain many additional indicators. You may also download an older 2014 version here.
Additional Notes
The estimates in the neighborhood profiles are derived from Census 5-year American Community Survey data (the latest available as of the publication year), and are only available at a neighborhood level through DataHaven. In this analysis, neighborhoods are defined by Census Tract, and all estimates are based on data allocated by Census Tract. Click on “Visible Layers” on the map to view the official Hartford neighborhood boundaries, which do not correspond exactly with Census Tracts. Census Tract and neighborhood-level data from the American Community Survey are subject to high margins of error. Please compare and use with great caution.
Please note that the Hartford Correctional Facility is located in the North Meadows neighborhood. Most of the population that lives in this neighborhood are incarcerated male adults living in the correctional facility. For this reason, there are few households. The population whose poverty status has been determined is also very small, because this status cannot be designated for individuals who live in prisons. Note that additionally, poverty status cannot not be determined for residents of nursing homes, college dormitories, or military barracks.
Please contact DataHaven for more information or to request a more detailed analysis.
[Note: This map is no longer active. Please view our Community Index Reports and Data Dashboard for more recent maps]
Click here to view our full report on this topic.