BY ARI ANISFELD
Urban centers are the engines of Connecticut's economy. They are job-centers, entertainment-providers, and home to 18 percent of Connecticut's population. But they also face the largest gaps when it comes to paying the bill. In 2015, Federal Reserve Bank of Boston’s New England Public Policy Center analyzed the fiscal affairs of every Connecticut town and found wide disparities.
The maps below provide a picture of municipal non-education spending and taxation that puts aside differences in town management and policy. In the NEPPC's analysis, cost forecasts are based on factors beyond any policymaker's short-term control, and revenue capacity is based solely on the current tax base. The outcome is not a revelation, but, by applying a statewide lens, it minimizes politics and highlights the structural nature of the disparities.
This suggests that bolder policy moves are required to alleviate urban fiscal distress, an issue that has been widely-identified as potential barrier to the economic competitiveness of Connecticut as it competes for jobs with other U.S. metropolitan areas.
[Note: The interactive maps used in this 2016 publication are no longer active. However, more current maps and data related to this page are included in our Community Index reports]
Urban cores face higher costs...
The first map shows the estimated cost of running municipalities on a per person basis, excluding education-related costs. The urban core had the highest costs, driven by population density, unemployment rates, and their role as centers of employment. One way to think about this is that urban resources—from city roads to police and fire forces—are simply used more. Higher density leads to higher fire risks. People without employment rely more on city services such as public transportation. Suburbanites, who pay property taxes elsewhere, demand city resources, like larger roads, when they go to work downtown. Wealthy areas, such as Westport, had the second highest costs. Higher private-sector wages in these areas suggest that municipal employees can demand higher wages.
The cost estimates were made based on five cost drivers: unemployment rates, population density, jobs per capita, prevailing private-sector wages and millage of roads per capita. The initial model included an additional factors, such as poverty rates, which were discarded because they did not display statistical significance. This is not to say that poverty is not a driver of structural disparities between municipalities. But rather, the authors found that it was less predictive of costs than the other five drivers, when looking at a statewide level.
And have lower taxing capacity...
Property taxes accounted for 94.4 percent of revenue Connecticut towns collect for themselves. The second map shows the structural ability for towns to collect this tax. To find these values, the NEPPC researchers calculated how much revenue each municipality could raise from its underlying tax base if every town used the same tax rate. Notice the range of values is much wider here and the urban core is, again, under the greatest structural strain. The capacity of the wealthy areas was over 8 times the urban core. Why? To address why, we need to know why property values in wealthy areas are much higher than in urban cores. While the answer is beyond the scope of the NEPPC analysis, the building stock, land use and socio-economic make-up of the population all factor in.
Subtract the capacity from the cost and we are left with the property-tax gap. The size of the gap is driven primarily by taxing capacity, though higher costs in urban areas also factor in. Focusing in on Fairfield and New Haven counties, urban cores like Bridgeport and New Haven show the highest gaps, while surrounding suburbs and wealthy areas show surplus.
It is important to remember that the measure of capacity was based strictly on property values and an idealized standard statewide tax rate. Two factors left to consider are other funding mechanisms, such as state grants and PILOT payments, and the actual tax rates. First, the NEPPC report looked at state payments and noted that they were not strictly distributed to reduce disparities. While lower capacity municipalities received a bulk of the grants, high capacity municipalities did too. Even after accounting for these payments, the gaps remain fairly large.
Second, municipalities tax property independently and the tax rates, commonly referred to as mill rates for property, are highest where the capacity is lowest. Hartford property owners pay a mill rate of 74.2, roughly six times higher than Greenwich. The outcome is that property owners living in Hartford pay a larger proportion of their wealth to property taxes. Greenwich per capita capacity is 11 times Hartford, so they are collecting more money per capita, but that represents a smaller share of their wealth.
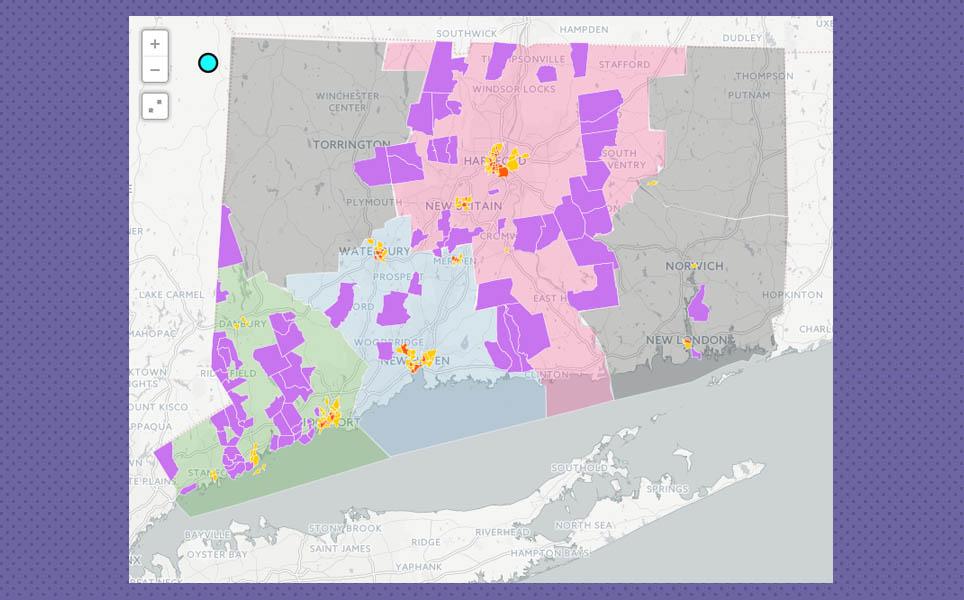
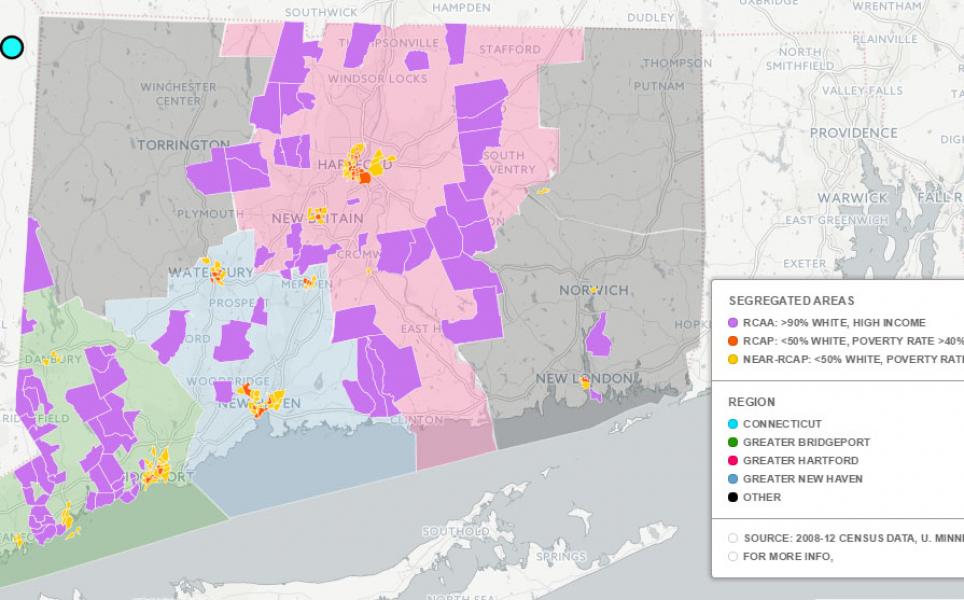
A 2015 DataHaven report highlighted the rise of income-based segregation in Connecticut, noting the location of neighborhoods where wealthier, whiter populations were concentrated. In Fairfield and New Haven Counties, all of the 48 "racially-concentrated areas of affluence" were located in a municipality with surplus. Racially-concentrated areas of poverty—defined as majority minority neighborhoods with at least 40 percent of the population below the federal poverty line—tended to fall within municipalities with large gaps (a few relatively small neighborhoods in Stamford and Norwark were the exceptions).
Note: Thomas Zembowicz, Urban Fellow, contributed to the production of this article. For the purposes of the text here, Urban Cores are defined based on The Five Connecticuts, 2004.


