
By Nat Markey (DataHaven), Mark Abraham (DataHaven), Jackie Gardner (ACT), and Katie Jennings (CCEH)
Introduction
Connecticut faces a growing homelessness crisis that could become far worse due to proposed policy changes at the federal level. Under a recent policy shift, more than 6,000 Connecticut residents currently housed in permanent supportive housing programs could have lost their homes, which would have tripled the state’s homeless population. This report published by DataHaven, United Way of Connecticut, the Connecticut Coalition to End Homelessness (CCEH), and Advancing Connecticut Together (ACT) aims to illustrate the detrimental impact of potential federal cuts, contextualize homelessness in Connecticut, and suggest realistic policy solutions.
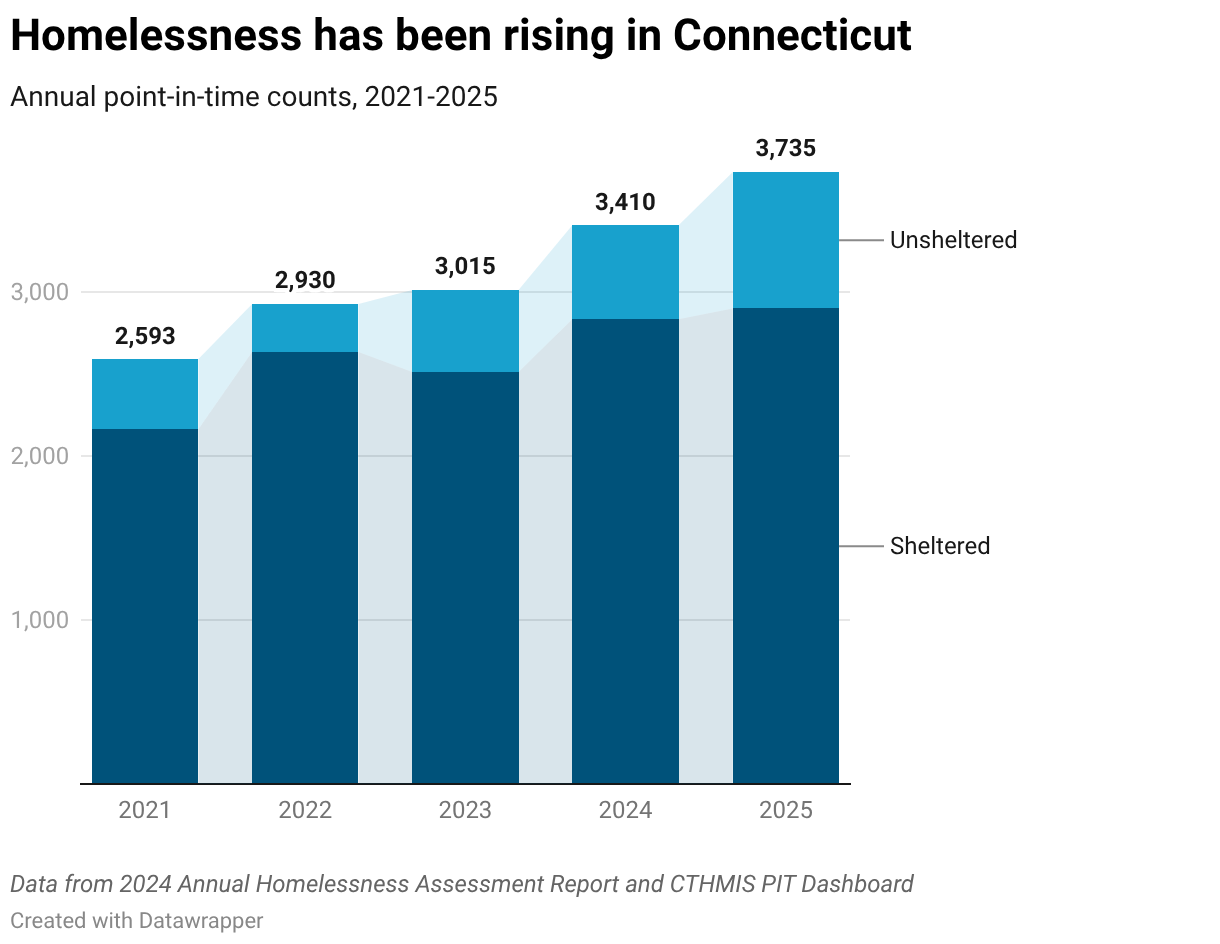
According to annual Point-in-Time counts, homelessness in Connecticut has increased each year from 2021 through 2025. The rise in unsheltered homelessness is particularly alarming, climbing from 294 people on a given night in 2022 to 833 people on a given night in 2025—a 183 percent increase. This included a 45 percent jump between 2024 and 2025.
Federal Funding at Risk
The federal funding that Connecticut relies on to provide stable housing to thousands of residents became uncertain in the fall of 2025. On November 13, HUD issued a new funding notice, known as a Notice of Funding Opportunity (NOFO), that would have drastically shifted billions of dollars away from the nation’s permanent housing programs. Specifically, the NOFO sought to modify the Continuum of Care (CoC) budget, which supports permanent housing and housing-first programs. The policy shift would have slashed permanent housing funding from 87 percent of the CoC budget ($3.3B) to a maximum of 30 percent ($1.1B), putting “approximately 170,000 formerly homeless people, including families with children, people with disabilities, veterans, and older adults, at risk of returning to homelessness,” according to Renee M. Willis of the National Low Income Housing Coalition.
This change came in spite of evidence showing that permanent supportive housing is the most effective method of reducing homelessness, while transitional housing is less effective (Urban, Peng at al. 2021, Tsemberis and Eisenberg 2000, Housing Matters). In the past, HUD has prioritized permanent supportive housing due to the evidence of its effectiveness, and there has been bipartisan support for this approach. Additionally, the NOFO was issued late in the funding cycle, meaning programs faced looming gaps in funding even if their awards were approved. While new awards would not have been distributed until June 2026 or later, one third of CoC programs have awards expiring between January and June 2026 (NAEH).
Immediate legal challenges from states and advocacy groups forced HUD to postpone abrupt changes to the program. In December 2025, the U.S. District Court in Rhode Island issued an injunction ordering HUD to preserve the status quo under the preexisting fiscal year 2024-2025 CoC Notice of Funding Opportunity. As of January 8, 2026, HUD announced that, as required by the court order, it will disburse CoC funds according to the system established before the November 13 NOFO.
More recently, as a result of these advocacy efforts, Congress included provisions in the final FY 2026 Consolidated Appropriations Act (P.L. 119-75) to ensure the swift renewal of FY 2025 CoC funding and to provide certain protections with respect to the FY 2026 CoC competition. Specifically, with respect to FY 2025 CoC funding, HUD must immediately non-competitively renew all projects expiring in quarter one (January through March) of 2026 for a 12-month period. With respect to FY 2026 CoC funding, HUD must keep Tier 1 funding, which is the amount of funding that is awarded based on CoC priorities, at 60 percent of a CoC’s Annual Renewal Demand (ARD) or higher. HUD must also release the FY 2026 Notice of Funding Opportunity (NOFO) for the CoC Program by June 1, 2026, and make awards by December 1, 2026. This is intended to prevent the delays and chaos that have characterized the FY 2025 funding process.
The passage of the FY 2026 Consolidated Appropriations Act is a positive sign for Connecticut’s homelessness response system. However, it is important to point out several gaps that remain. First, CoC funding was flat between FY 2024 and FY 2025, meaning that current funding levels do not account for inflation and rising housing costs. As a result, there will likely be a gap between the amount available in FY 2026 and the amount needed to cover eligible renewals. This includes more than 200 projects awarded originally under the Special NOFO to Address Unsheltered and Rural Homelessness, which were not eligible for renewal in FY2025. Second, while HUD has historically set Tier 1 funding at 90% or more of a CoC’s ARD, the change to set it at 60% or higher could affect the amount of CoC funding Connecticut ultimately receives, resulting in cuts to critical housing resources and placing thousands of Connecticut residents at risk of homelessness. Third, lawsuits filed against HUD in the U.S. District Court of Rhode Island remain pending as of early February 2026. HUD has submitted filings as recently as February 6, 2026 in both Case 1:25-cv-00626, State of Washington v. United States Department of Housing and Urban Development, and Case 1:25-cv-00636, National Alliance to End Homelessness v. United States Department of Housing and Urban Development, maintaining that “[t]he passage and enactment of the most recent applicable appropriations act on February 3, 2026, affirms that Congress intended HUD to have the discretion to revise NOFOs and to renew projects competitively.”
In light of these gaps and threats, is vital that Connecticut policymakers continue to work to address community needs, remain vigilant, and be prepared to take immediate action should further funding disruptions occur.
Mapping Potential Local Impacts
Data from the Connecticut Homelessness Management Information System show that over 6,000 people across the state are in CoC-funded permanent housing projects, meaning that they are at risk of losing their housing from any future HUD cuts. Under the recent HUD announcement, the state would have lost up to $98 million per year in federal funding for homelessness response.
Homelessness is a statewide issue in Connecticut, not just an urban one. Homelessness exists in small towns and rural communities, shoreline and tourism-based economies, and suburban communities, which often have little shelter capacity. Additionally, people sometimes must seek services outside their home town, which can mask local impact. Even examining data on where people are served, the maps below demonstrate that homelessness affects all types of Connecticut communities. For example, in State Senate District 29, which is positioned in the mostly-rural northeast corner of the state, over 200 people would be at risk of losing permanent housing in the event of these HUD policy changes. Over 100 people would be at risk in State Senate District 30, located in the far northwest corner of the state. Urban centers, which often provide services for adjacent towns, would be especially impacted. Approximately 1,000 people in New Haven, 800 in Hartford, 600 in Bridgeport, 400 in Stamford, and 300 in Waterbury would be at risk of losing their permanent housing. Smaller cities would be hit hard as well, with over 200 people at risk of losing their permanent housing in New London’s State House District 39, the most of any State House District in Connecticut.


Background: Understanding Homelessness in Connecticut
Understanding what actually causes homelessness is critical to solving it. While the current federal administration has justified its policies by arguing that substance abuse and mental illness are the “root causes” of homelessness, Connecticut data tells a different story, suggesting that income and housing affordability are the most important factors.
When people enter emergency shelters in Connecticut, they provide information about the circumstances leading to their becoming homeless. They often provide multiple factors contributing to their loss of housing, and they are asked to select one of those factors as the primary reason they became homeless. In Connecticut, the top three primary causes of homelessness—together representing 63 percent of all emergency shelter clients—were related to income and housing affordability. The most common primary cause was “expenses exceed income,” followed by “doubled up” (meaning people are sharing housing with others due to losing their own) and “legal eviction or foreclosure.” Substance use disorder and mental health problems were each the primary cause for fewer than one in ten clients (see below).
Primary Causes of Homelessness, FY2025
Expenses Exceed Income: 28%
Doubled Up: 22%
Legal Eviction or Foreclosure: 13%
Mental Health Issues: 9%
Substance Abuse Problems: 9%
Physical Health Issues: 7%
Domestic Violence Victim/Survivor: 4%
Other Reasons: 8%
Source: Homeless Management Information System (HMIS) Emergency Shelter Intake Data Collection
Rising housing insecurity and decreasing housing affordability help explain Connecticut’s recent increase in homelessness. Results from the DataHaven Community Wellbeing Survey (DCWS) indicate an all-time high in housing insecurity. In 2025, 11 percent of adults in the state—over 300,000 people—said they ran out of money for housing in the past year, with this share approximately doubling since the survey was first conducted in 2015.
Connecticut’s housing market has become increasingly tight since the pandemic for both buyers and renters. Although a new Census data source shows that the state increased housing production and gained 40,000 new housing units from 2020 to 2025, the value of a typical home has jumped 59 percent since 2020, the third biggest increase of any state in the nation, while the stock of housing inventory actively for sale has dropped by 69 percent since 2019, the biggest decrease of any state. Meanwhile, Connecticut saw a 34 percent increase in average two-bedroom fair market rent and a 35 percent increase in average one-bedroom fair market rent from 2020 to 2025.
According to Advancing Connecticut Together, average rental assistance payments on behalf of clients have increased by 50 percent in recent years to keep pace with rising housing costs. Although the average amounts are still below the fair market rent benchmark, indicating that Connecticut is stretching dollars to help as many people as possible, rising costs mean that fewer people can be served with the same amount of funding. The federal government’s unprecedented cuts to SNAP, Medicaid, and other programs that benefit hundreds of thousands of low-income households in Connecticut could further compound the severity of homelessness in the state.
People of all ages and abilities in Connecticut experience homelessness. Data on people served by both emergency shelter and street outreach programs show that 23 percent of people in emergency shelters, and 27 percent of people enrolled in street outreach, are age 55 or older. Families with children are also at risk: 18 percent of people in emergency shelters are children. Additionally, 42 percent of emergency shelter clients and 57 percent of street outreach clients have one or more disabling conditions.

Affordability challenges are not going unnoticed by Connecticut residents. According to the 2025 DCWS, Connecticut residents are widely concerned about government response to these challenges. Over 60 percent of adults statewide say the government is providing too little assistance to support safe, high-quality housing for people with limited incomes, compared to only 10 percent who say that the government is providing too much assistance. An even greater majority—nearly 3 out of 4 adults—are somewhat or very concerned that current governmental policies will cause more people to have trouble affording housing.
Conclusion and Recommendations
Connecticut’s homelessness crisis demands urgent attention at the local, state, and federal levels. The data are clear: unaffordability is a primary driver of the rapid increase in homelessness in Connecticut, and the more than 6,000 residents in permanent supportive housing remain at risk from any future HUD policy shifts. The potential costs to communities and individuals are enormous.
Housing advocates are sounding the alarm about these compounding pressures. According to Lisa Tepper Bates, President and CEO of United Way of Connecticut, “the rising cost of essentials—from food to utilities to housing—has created a perfect storm for families across our state. United Way of Connecticut 211 sees the strain every day: last year, one in three calls was related to housing or homelessness—a more than 25 percent increase over the past five years. Proposed federal cuts to housing and homelessness services threaten to make this situation worse.”
According to Sarah Fox, CEO of the Connecticut Coalition to End Homelessness, “Recent developments have demonstrated how tenuous the availability of federal funding can be. This moment calls for a response equal to the need before us, especially as federal funding grows increasingly uncertain. If we are serious about preventing, responding to, and ultimately solving homelessness, we must scale coordinated statewide investment to the size of the problem.”
As legal challenges and policy shifts continue, Connecticut should act now to strengthen its housing programs. The state needs immediate action to stabilize housing programs that are so important across all communities, to address the affordability crisis that is driving sharp increases in homelessness, and to protect the evidence-based programs that have proven effective at keeping people housed.
About this Report
Across Connecticut, 1 in 4 adults are currently living with some form of disability. The disability community, which includes those reporting difficulty with cognition, vision, hearing, mobility, self care, or independent living, is not monolithic. Disability affects people’s lives in many ways, and Connecticut adults with disabilities can experience significant well-being disparities compared to those without disabilities.
These disparities arise from societal failures to adequately meet the needs of individuals with disabilities. Further, this brief is being written in the political context of rollbacks on previous policy wins across the spectrum for vulnerable groups. Federal funding for social programs has been deeply cut, a move that will disproportionately impact community members with disabilities. A detailed review of the racist and eugenicist history of systematic marginalization directed at people with disabilities is outside of the scope of this brief, and we encourage readers to seek out further resources to understand this community more holistically. A nonexhaustive suggested reading list is available in the appendix of this document.
This report explores data on the experience of adults with disabilities in Connecticut from the DataHaven Community Wellbeing Survey (DCWS). The DCWS illuminates major gaps in economic well-being, health, and health care access between adults with and without disabilities in Connecticut. The DCWS also reveals worse self-reported outcomes for people with disabilities across other indicators related to quality of life, both at the individual and community level.
This is a PDF version of the report. Please see the main report page for more information.
By Andrew Carr, Nat Markey, and Mark Abraham, DataHaven
Introduction
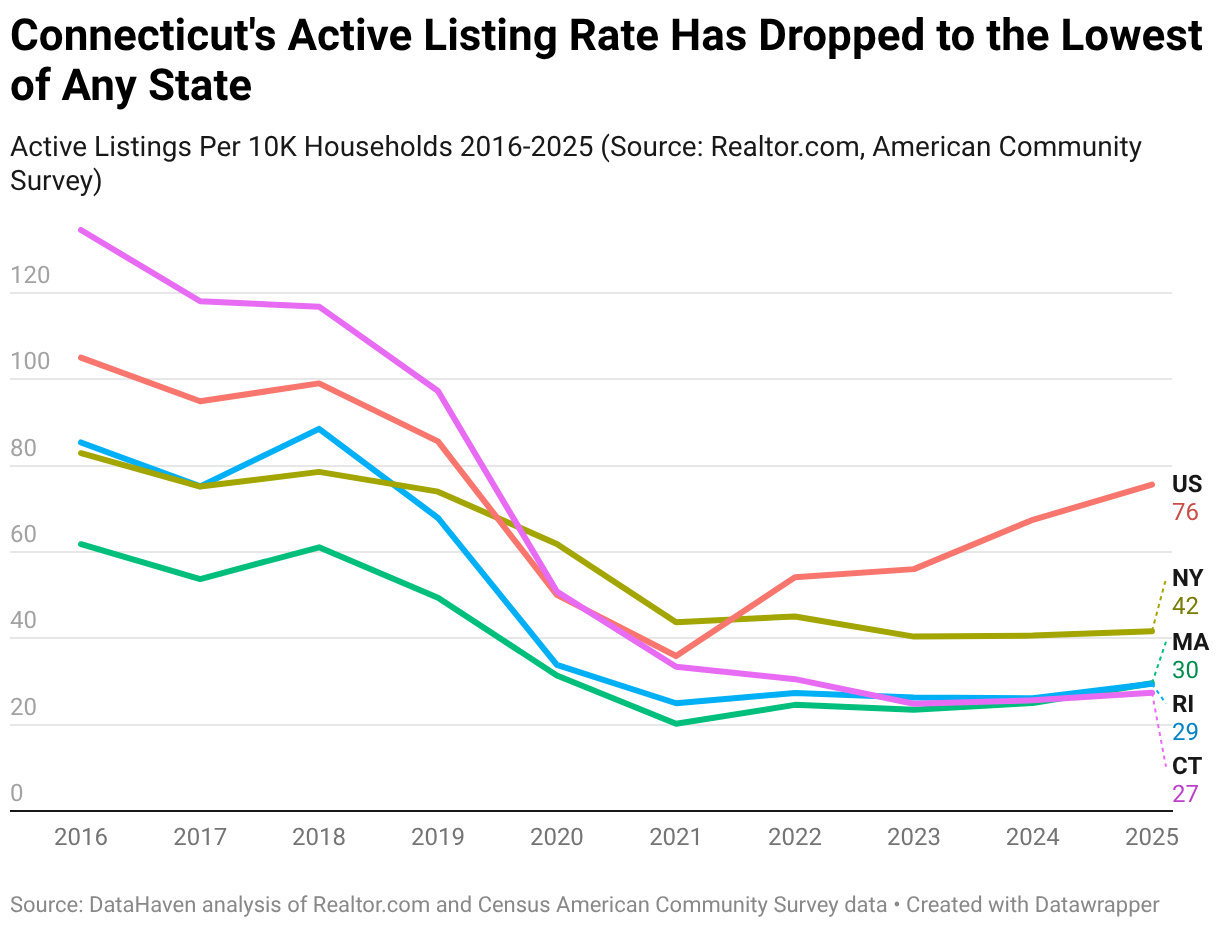
Connecticut is facing a historic housing affordability crisis. The state currently ranks dead last nationally in the number of active housing listings for every ten thousand households (see chart below), as well as in its ratio of housing units to households. Connecticut also ranked second to last in its rental vacancy rate, as of 2024. And according to the Connecticut Coalition to End Homelessness, homelessness in Connecticut rose by 44 percent since 2021, and unsheltered homelessness rose by 45 percent just within the past year.
For legislators and advocates working to address this crisis, having reliable data to understand the true scope of housing production is essential to crafting effective policy.
New U.S. Census data product could present a more accurate picture of housing production
Until recently, policymakers have relied on The Census Building Permits Survey (BPS) as a primary source to track new housing construction. However, these data have many limitations. For example, municipalities could underreport permits, and some projects such as conversions of non-residential buildings into housing are typically not counted. More importantly, building permits are a flawed proxy of the number of housing units. Permit data do not account for demolished buildings or buildings that have become uninhabitable. Sometimes, permits that are counted in the data do not result in completed housing projects.
The U.S. Census Bureau recently introduced a new data product, Census Address Counts, that could offer a better measure of the housing supply. More analysis is needed to determine if there are inaccuracies in this new dataset, but it could offer advantages over the building permit survey data. Census Address Counts uses Decennial Census and USPS data to provide the numbers of housing units at the block level, accounting both for new units as well as demolitions. Unlike the building permit data, these address counts are based on housing that has already been built. Data are available for 2020, 2023, and 2025.
For this report, DataHaven analyzed the new Census Address Count data to determine whether Connecticut’s housing supply is growing at a fast enough rate to address the housing shortage.
Geography of the new housing supply in Connecticut
To understand where new housing is being added in Connecticut, DataHaven aggregated the Census Address Count data from the block level to the Regional Council of Government (COG), tract, and town levels. Census Address Count data by town is shown in the interactive map below. Click or hover over a town to see the net and percent change in the number of housing units, the number of units in 2020, and the number of units in 2025.

Over the past five years, the housing supply has increased unevenly across the state. Cities in the central and western part of Connecticut saw the largest increases in the numbers of housing units since 2020. New Haven added 3,535 units, Stamford added 3,512 units, and Hartford added 2,082 units.
Of the forty thousand units that were built since 2020, twenty-six thousand (65 percent) were in the Capitol, Western, and South Central COGs. These three regions are also home to 67 percent of Connecticut’s jobs as of Q4 2024, according to a DataHaven analysis of Quarterly Workforce Employment Counts. Overall, these areas also saw slightly more housing growth as a percentage of the number of housing units in these areas. The Western, and South Central, and Capitol COGs experienced a 2.8 percent increase in the number of housing units between 2020 and 2025, while the Northeastern and Northwest Hills COGs saw a 2 percent increase during this time.
The bar chart below shows a ranking of units added by town. Housing growth over the past five years has been heavily concentrated in a small number of towns. The ten towns with the most growth accounted for 39 percent of new housing in Connecticut. Stamford and New Haven added more homes than the bottom 100 towns combined.

Looking more closely at the neighborhoods within towns, it is clear that the most rapid increase in housing supply is generally taking place in downtown core areas, especially New Haven and Stamford, with comparably few new homes being added in nearby areas such as Milford and Greenwich that in some ways are equally if not more accessible to jobs and mass transit.
The map below allows policymakers to visualize the census tracts that have expanded housing supply by 12 percent or more, as well as those that have added very few new homes. You may need to use the buttons to zoom into small geographic areas such as downtown Stamford.

New data show progress, but not nearly enough to meet growing needs
Since 2020, the number of housing units in Connecticut has increased by forty thousand from 1,530,000 to 1,570,000. While Connecticut added 6,000 new units per year between 2020 and 2023, it added 10,000 new units per year from 2023 to 2025. This means that the rate of new housing supply in Connecticut also accelerated during this period.
Whether Connecticut can maintain this pace of new housing supply is unclear. It is important to note that despite the apparent increase in the rate of housing supply in Connecticut over the past three years, overall rates of new home construction in Connecticut each year have been among the lowest in the United States since the 2008 financial crisis. From 1998 to 2007, Connecticut permitted between about 8,000 and 12,000 new homes almost every year, but the number of permits fell sharply in 2008 and ranged from about 3,000 to 6,000 each year from 2008 through 2021. Looking forward, economic conditions, tariffs or other policies that increase the cost of materials, and immigration policies that reduce the availability of construction workers, call into question whether the current rate of housing production in Connecticut can be sustained.
According to the 2025 Connecticut Fair Share Housing Study, low-income residents in Connecticut face a shortfall of about 120,000 housing units. In other words, there are 120,000 more low-income households than there are housing units affordable to these households. The overall housing gap is even larger according to that report: up to 380,000 units statewide. At the current pace of new supply, it could take 50 years to close that gap. Even if the true shortage is smaller, producing enough housing would still take decades at today’s rate.
Demographic trends suggest that demand for housing will continue to rise. The number of households is growing. According to the Connecticut Housing Finance Authority, in 2024, there were roughly 78,000 more households than there were in 2019, an increase of nearly 6 percent. As residents live longer and more people retire, most “age in place” rather than downsizing or leaving the state. At the same time, demand is coming not only from workers moving into Connecticut to fill those existing job openings, but also from people already here: young adults leaving their parents’ homes or entering the workforce and forming their own households. Each of those transitions creates the need for additional housing. Average household sizes are also shrinking, as fewer people choose to live with roommates or extended family. As a result, even if the population were to remain steady, the demand for new housing supply would still increase with the rising number of households and the gradual loss of existing housing units (due to deterioration, fire, conversion to other uses, and other factors).
Rising income and wealth inequality is also driving up housing demand in counterproductive ways. Higher-income households are more likely to purchase large homes on larger lots, which could reduce the number of units produced on any given parcel of land. Wealthier households may even combine multiple units, for example, by converting existing two-family homes into single-family homes, by combining two apartments into one, or by tearing down two homes in order to build one larger home. Rising inequality could mean that the existing housing stock serves fewer households, exacerbating the shortage for everyone else.
Conclusion: A plan to address statewide housing insecurity
In summary, it could take several decades for Connecticut to build enough homes to meet current residents’ housing needs, at least at the current rate at which homes are being built. The newly-released Census Address Count data product featured here has block-level data that could help policymakers understand where homes have been built, and where they haven’t, perhaps more accurately than before.
Policymakers should consider legislation that could help accelerate the rate of new housing production, particularly in towns that are located near job centers such as Hartford, New Haven, and New York City. The recently passed H.B. 8002 has some zoning reforms, including prohibiting towns from requiring off-street parking of buildings with more than 16 units. However, the law leaves Connecticut’s zoning laws largely intact.
To create a significant increase in the rate of new housing development, policymakers could reform CT General Statute 8-2, which grants municipalities the authority to implement zoning restrictions and otherwise regulate land use. Other changes, such as allowing multi-family housing by-right in areas near transit and job centers, streamlining permitting processes and regulations (such as through “single stair” reform) to reduce the cost of construction, subsidizing the cost of infrastructure and brownfield remediation, converting underutilized state and municipal-owned properties into sites for housing development, and removing other barriers to construction, could also accelerate housing production. The Connecticut Business & Industry Association (CBIA) Foundation for Economic Growth & Opportunity has suggested approaches like these in its report on the economic impact of Connecticut’s housing shortage.
Given the rapid increase in homelessness and housing insecurity in Connecticut in recent years, immediate investments in housing subsidies, household-level tax credits, and supportive housing are essential to consider as well. According to the DataHaven Community Wellbeing Survey, the number of adults in Connecticut who ran out of money to pay for their housing in the past year has doubled: from about 150,000 in 2015 to 300,000 in 2025. The survey also shows that this increase is associated with a large rise in food insecurity, especially among children, and rising numbers of adults postponing needed healthcare. The Connecticut Town Equity Reports show that housing affordability is an issue across urban, suburban, and rural towns throughout the state.
While this surge in housing insecurity, particularly among middle-income households, is largely driven by the state’s extreme shortage of housing, it cannot be solved only by new supply. Even with more homes and more stable prices, significant investments would still be needed to support vulnerable populations who face ongoing barriers to housing, such as lack of income, disabilities, health challenges, or family instability.
Connecticut is building new homes, and the pace of new supply seems to be increasing. But without significant reform, the state could be waiting a half century or longer to meet current housing needs. Bold action is essential to ensuring that all Connecticut residents have access to affordable, high-quality homes, to give employers the workforce they need, and to allow the economy to work in ways that benefit everyone.
By Andrew Carr, Mark Abraham, and Nat Markey, DataHaven
Introduction
The recently passed One Big Beautiful Bill Act (H.R. 1) will have unequal effects on American families and will contribute to income and wealth inequality. A recent report from the nonpartisan Congressional Budget Office (CBO) shows that H.R. 1 will increase after-tax earnings for households at the top of the income distribution, while negatively impacting households in the bottom fifth of the distribution.
The CBO estimates weighed the positive effects of reduced taxes against the costs of reductions in Medicaid and SNAP in order to estimate average effects on each decile of the household income distribution.
For this report, DataHaven combined the CBO estimates with U.S. Census data to estimate the impact of H.R. 1 tax relief on the bottom quartile (less than or equal to the 25th percentile), middle 50 percent (between the 25th and 75th percentiles), and the top quartile (above the 75th percentile) of each Connecticut town’s household income distribution. The Methodology section below has detailed information on how we produced these estimates.
Results
Overall, we estimate that the bottom 25 percent of Connecticut households will collectively lose $148 million (an effect of negative $417 on average) due to H.R. 1. Meanwhile, households in the middle of the distribution will collectively receive $1.3 billion in tax relief ($1,815 on average), and households in the top 25 percent will receive $3.4 billion in tax relief ($9,535 on average).
Our estimates of the aggregate effects on households in each town, and the distributions of those households by income group within each town, are shown in the map above. Click on the map to explore data for each town. Estimates of the effects on individual households living in each town, county equivalent (COG area), and income group within each may be found in the Additional Interactive Maps and Data section below.
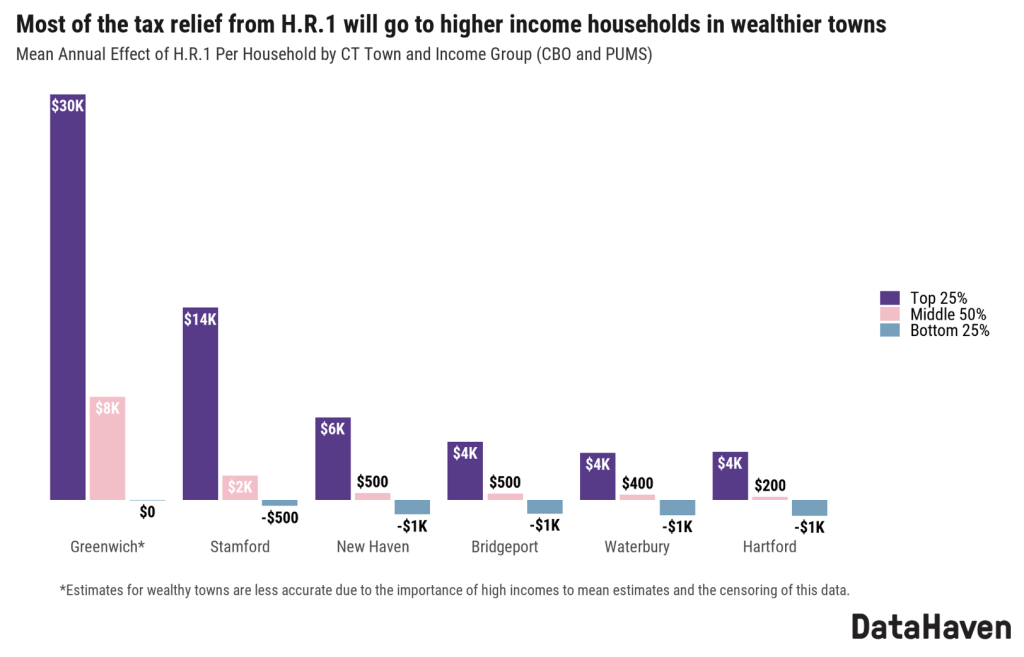
The figure above shows the effects of H.R. 1 by income group within select Connecticut towns. Most of the tax relief from H.R. 1 will accrue to the 25 percent of households with the highest incomes in each town. For example, high-income households in Greenwich will benefit from an additional $30K in tax relief per year on average, $22K more than the $8K that households in the middle of Greenwich’s income distribution will receive each year. The bottom 25 percent of Greenwich households will receive an average of $0 in tax relief.
In New Haven, Bridgeport, Waterbury, and Hartford, middle-income households will experience negligible benefit from H.R. 1, while low-income households will be negatively affected. For example, in New Haven, the top 25 percent of households by income will each receive $6,200 in tax relief on average, households in the middle will each receive $500 in tax relief on average. The bottom 25 percent of New Haven households by income will each see a $1,100 loss on average.
Our estimates showing unequal tax relief by community do not convey the full extent of hardship that H.R. 1 will impose on low-income households, as much of the negative effect of the bill will be experienced through loss of benefits like healthcare and food assistance. Additionally, the estimates in the CBO report do not consider how other current policies such as tariffs (projected to cause price increases equivalent to a $1,900 to $7,600 loss in average disposable income per household), or how the indirect impacts of the H.R. 1 legislation on society (such as through increased debt service, macroeconomic effects, and potentially catastrophic, community-wide losses of healthcare coverage), will ultimately impact families at different income levels and across different neighborhoods in Connecticut.
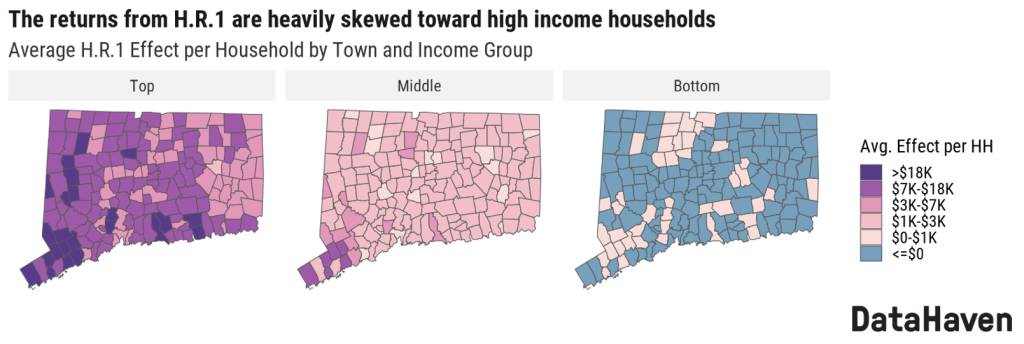
The above panel of maps shows how H.R. 1’s effects are distributed across income groups and towns. Each of these maps shows the average annual effect for the top 25 percent, middle 50 percent, and bottom 25 percent of households by household income.
The right map indicates that low-income households in most towns will be negatively affected by H.R. 1. The middle map shows that although H.R. 1 will affect middle-income households on average across all towns, these benefits will be less than $3K per year in most towns. Middle-income households in 70 percent of towns will receive less than $2K per year in tax relief, and in 16 towns they will receive less than $1K per year. The left map shows that the benefit of H.R. 1 will be heavily skewed toward the top 25 percent of each town’s income distribution. In 23 towns, high-income households will save more than $18K per year on average. In four towns – Greenwich, Darien, New Canaan, and Westport – high-income households will see tax relief of more than $30K per year on average. The top quartile of household incomes in these towns is comprised of households whose incomes are in the top two percent of the national household income distribution.
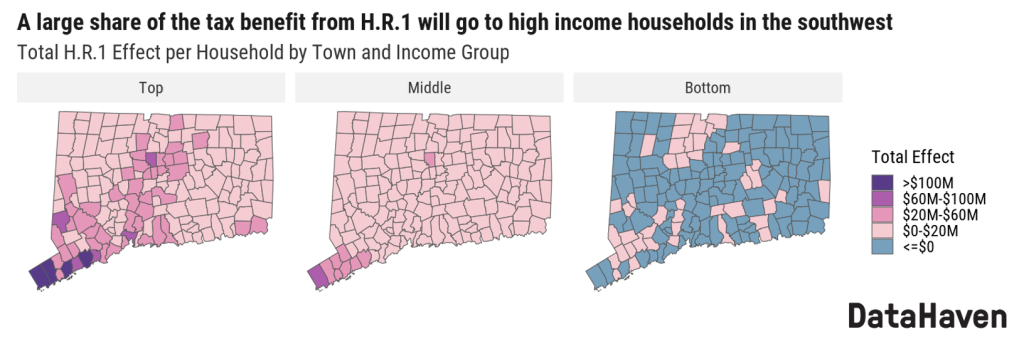
This next panel of maps shows the total effect of H.R. 1 by town. These maps take into account the household populations of each town. The left map shows that a disproportionate share of the additional money flowing to Connecticut households due to H.R. 1 will go to high-income households in the southwest part of the state, especially in Stamford ($195 million for high-income households), Greenwich ($173 million), Norwalk ($116 million), and Fairfield ($116 million). The right map shows that for most towns, the lowest-income 25 percent of households living in that town will experience a negative effect from the legislation.
Overall, the towns seeing the largest tax relief in the aggregate will be Greenwich ($262 million), Stamford ($239 million), Fairfield ($158 million), Norwalk ($143 million), Westport ($121 million), and West Hartford ($121 million), even though the bottom 25 percent of households across those 6 towns will collectively lose $12 million. Households in the state’s largest city, Bridgeport, will receive only $60 million in total, with $61 million in tax relief flowing to high-income households in that city, while the bottom 25 percent of households living in Bridgeport lose over $14 million.
Additional Interactive Maps and Data
Click here for a downloadable Excel spreadsheet with estimates for Connecticut towns, COG areas, and the state, and by income group within each area.
Discussion
The findings in this report indicate that H.R. 1 will considerably exacerbate the problem of rising income inequality in Connecticut, which has been increasing in the state since 1970. And even if H.R. 1 is eventually repealed, the impact on wealth inequality is likely to be permanent.
One way that wealth inequality appears at a community level is through unequal access to public infrastructure, such as quality parks and libraries. Wealthier towns and neighborhoods often have more money and political influence to dedicate towards maintaining high-quality public spaces. For example, in Greenwich, 93 percent of adults say their parks are in good condition and the town spent $182 per person on libraries in 2021, while in nearby Bridgeport, only 56 percent of adults report good-quality parks, and library spending was just $58 per person.
Resource gaps are closely tied to differences in health and longevity as well. According to the 2023 Fairfield County Community Wellbeing Index, adults under the age of 75 living in Bridgeport lost years of life at a rate more than three times higher than those in Greenwich, reflecting sharp differences in community investment. The disparity widened by H.R. 1’s impacts on tax policy could be further compounded as H.R. 1 also causes tens of thousands of area residents to lose access to healthcare and food assistance.
Increasing wealth inequality can also contribute to the state’s housing affordability and homelessness crisis, and reduce social mobility.
We encourage policymakers to use this report and data to understand and remedy the disparate impacts that H.R. 1 will have on their constituents.
Methodology
Estimating the effects of H.R. 1 on Connecticut towns consisted of two steps: estimating national income percentiles for each Connecticut household and mapping these percentiles to a distribution of H.R.1 effects.
Estimating income percentiles for Connecticut households
Connecticut households were ranked according to where they fall on the national household income distribution. ACS PUMS data for 2019-2023 was used to create a table of household-size adjusted household incomes by percentile for the United States.
Next, the ACS summary table B19001 was used to estimate household incomes for each Connecticut town. This data provides counts of households by income bin (less than $10K, $10K-$20K, ect.). The binsmooth R package was used to estimate samples of exact incomes from these counts.
These incomes were adjusted for household size. First, shares of household sizes (1, 2, and 3 or more) were calculated for each PUMA. Then, each town’s incomes were divided into groups by household size based on the household size distribution of the PUMA in which the town is located. The incomes were adjusted by household size by dividing by the square root of the household size.
Finally, each household’s percentile was calculated from its size-adjusted income based on the percentiles of the national income distribution.
Mapping from income percentile to H.R.1 effect
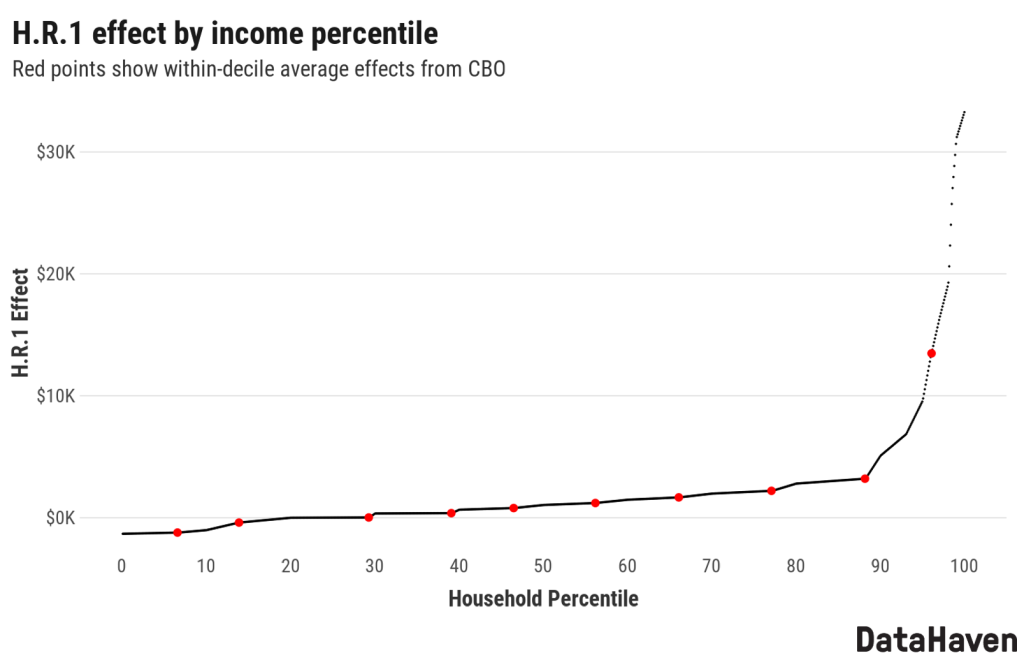
The CBO report provides ten estimates, the average H.R. 1 effect for each decile of the household income distribution. These CBO estimates are based on results from a microsimulation study from the Joint Committee on Taxation.
These estimates were used to plot coordinates of the cumulative share function of the H.R. 1 effect. This function is also known as the Lorenz curve.
These points were then interpolated to get the H.R. 1 effect cumulative share as a function of the household income percentile. The reason for using the cumulative share function is that CBO’s estimates can be converted into points on this function. For example, CBO estimates an average effect of -$1,214 for the bottom decile. This can be divided by the sum of the average effects of each decile to get -.056, the share of the bottom bin. The cumulative sum of the effects can be divided by the sum of all ten effects to plot points along the cumulative share function.
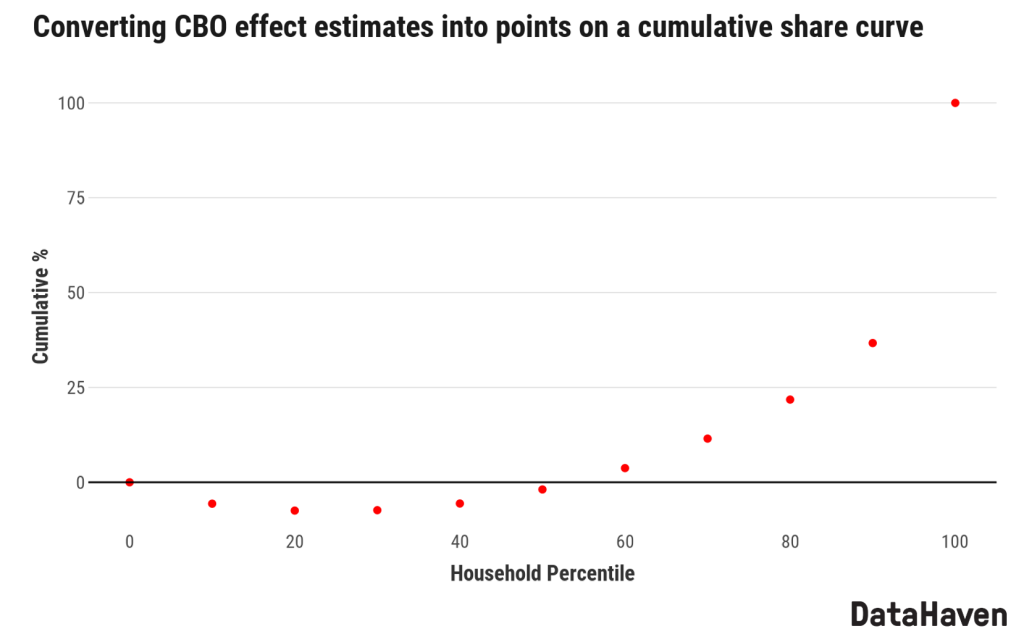
This plot shows the degree to which H.R. 1 disproportionately benefits the top decile, which is estimated by CBO to receive about 63 percent of the H.R. 1 benefit. This indicates that the distribution of H.R. 1 benefits, like the distribution of income, is right skewed. This poses a challenge for interpolation. The interpolated function must have two properties: first, the effect should increase from left to right along the range of percentiles. We can ensure this by fitting convex quadratic functions to each pair of points. Second, the slope of the function for the top bin should increase at an increasing rate to capture the right skew of the distribution. This is approximated by manually adding points, represented by the blue points below. The points are interpolated with a set of convex quadratic polynomial functions using the schumaker R package. The image below shows the interpolated function.
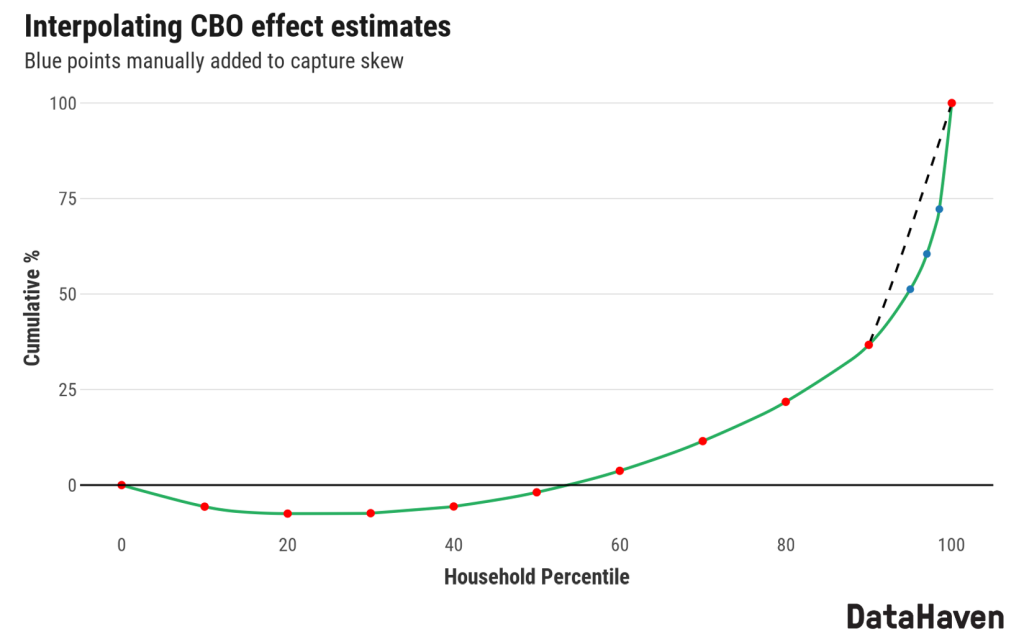
The black dashed line shows how the Schumaker method interpolates the top bin by default. This creates a discontinuity in the slope increase of the interpolated function. The blue points result in a function whose slope increases more smoothly. These additional points have no bearing on the total or average effect within the top decile. Rather, these points influence the distribution of effects within the decile (reducing the incomes closer to the 90th percentile and increasing the incomes closer to the 99th percentile).
H.R. 1 effects can be calculated from this function by multiplying the derivative at any point along the curve by the average effect, which can be calculated from the CBO estimates. The plot below shows the distribution of effects by percentile.
Finally, an H.R. 1 effect is assigned to each household based on its percentile.
The income groups for each town are based the town’s 25th and 75th household income percentiles. The percentile levels that determine the income groups vary considerably by town. For reference, in Connecticut as a whole, the bottom 25% of households by income earn less than $46,000, the middle 50% earn between $46,000 and $167,000, and the top 25% earn $167,000 or more.
The DataHaven website was redesigned by Studio Kudos in November 2025. Stay tuned to our social media pages for more information on how to navigate the new site!
Previous versions of the DataHaven website included:
- A Drupal version designed by Studio Kudos, which was live from 2015 to 2025, on which this site is largely based.
- A WordPress version, live from 2009 to 2015.
- The original version of DataHaven, live from 2003 to 2009, which featured a community indicators lookup tool.
By using a scientific, random-sample approach, the DataHaven Community Wellbeing Survey (DCWS) produces reliable local data for every Connecticut city and town, along with detailed insights about adults of different backgrounds and life experiences that no other public source provides. Drawing on interviews with more than 50,000 randomly selected adults across every ZIP code, the DCWS is believed to be the largest neighborhood-level quality-of-life survey in the United States.
The DCWS is informed by an Advisory Council of several hundred individuals representing organizations across the state, and has received financial support from over 100 public and private partners. Quantitative and qualitative data from the DCWS have been featured in hundreds of publications about all aspects of quality of life in Connecticut, including DataHaven’s Town Equity Reports and regional reports, as well as in many community health assessments and federal grant applications.
- 2025 DCWS, 2024 DCWS, 2022 DCWS, 2021 DCWS, 2020 DCWS, 2018 DCWS, 2015 DCWS, 2012 DCWS
- Research Advisory Committee and Advisory Council
- Survey Funders
2025 DataHaven Community Wellbeing Survey (Wave 8)
Wave 8 of the DCWS completed in-depth interviews with 1,371 randomly-selected adults in every Connecticut town from August to October 2025. The first set of DCWS results were published on November 6, 2025, and may be found below. Unlike our larger survey waves that produce granular town- and regional-level estimates, the 2025 DCWS was mostly designed to produce detailed statewide estimates as well as data for smaller population groups within the state.
2025 Survey Results
- Press release announcing the 2025 DCWS survey results: View on our website
- Statewide Connecticut Crosstabs, containing methodology description, survey demographics, and detailed data broken down for population groups (age, sex, race/ethnicity, Puerto Rican origin, income, education, geography, disability, incarceration experience, and other categories), November 6, 2025: DataHaven2025_Connecticut_Crosstabs_110625b
- Data Placemats from our November 6, 2025 Statewide Data Release Event in Hartford, CT: Nov 2025 Data Release Placemats 110625
- Slides from our November 6, 2025 Statewide Data Release Event in Hartford, CT: DataHaven_DataReleaseEvent_110625
Additional results from the 2025 DCWS will be released later this fall and next year. An Excel version of the Connecticut Crosstabs is available on request. Please contact DataHaven for more information.
2024 DataHaven Community Wellbeing Survey (Wave 7)
Wave 7 of the DCWS completed in-depth interviews with 7,458 randomly-selected adults in every Connecticut town. The first set of DCWS results were released on November 25, 2024 and may be found below. DataHaven has distributed detailed results by neighborhood, town, and region to community partners throughout the state; please contact us with inquiries.
In 2024, DataHaven also worked with local partners to field a 2024 Community-Based Assets and Needs Survey (CBANS), which was designed to collect data with specific population groups. Results from the CBANS are not directly comparable to the population-based results from the DCWS, even though many of the questions are identical.
2024 Survey Results
- Press release announcing commencement of the 2024 DCWS survey and list of funders
- Press release with results from Statewide Data Release Event: datahaven press release v1 112524
- Connecticut statewide crosstabs with methodology description, survey demographics, and data broken down for detailed population groups (age, sex, race/ethnicity, Puerto Rican origin, SOGI, incarceration experience, disability, income, education, and many others), November 25, 2024. Excel Version: dcws_connecticut_2024_EventVersion
- Crosstabs for individual cities, towns, and regions were distributed to survey partners throughout the state, and are available on request. In addition, 2024 survey data are incorporated within our Connecticut Town Data Viewer and other publications.
2022 DataHaven Community Wellbeing Survey (Wave 6)
DataHaven fielded a sixth wave of the survey in summer 2022. The 2022 DCWS interviewed 1,196 randomly-selected residents throughout Connecticut, as it was mostly designed to produce state-level estimates, unlike our larger surveys that produce town- and regional-level estimates. Results are also included in the 2023 DataHaven Community Wellbeing Index reports.
2022 Survey Results
- September 16, 2022 press release with preliminary data on food insecurity in 2022
- Data crosstab with 2022 statewide data broken down by 5CT town type, sex, age, race/ethnicity, education, income, children
2021 DataHaven Community Wellbeing Survey (Wave 5)
From June to December 2021, DataHaven completed Wave 5 of the DataHaven Community Wellbeing Survey with support from dozens of hospitals, charitable organizations, and public agencies throughout Connecticut. The 2021 survey involved live interviews of 9,139 randomly-selected Connecticut residents in every town. Results are also included in the Town Equity Reports, Community Wellbeing Index reports and Community Health Needs Assessment reports published throughout the state in 2022 and 2023.
2021 Survey Results
- Press release announcing commencement of 2021 Community Wellbeing Survey and list of funders
- July 2, 2021 press release on preliminary June survey results regarding vaccine equity
- October 6, 2021 press release on Summer 2021 statewide survey results – post includes detailed data crosstab with preliminary statewide data
- February 13, 2022 press release on the full set of survey results (June through December 2021), including highlighted data for Connecticut towns – post includes detailed data crosstab with final statewide data
- Additional crosstabs with town-level and regional-level data are available on request.
2020 DataHaven Community Wellbeing Survey (Wave 4)
DataHaven fielded a special “COVID-19 rapid response” wave of the statewide DataHaven Community Wellbeing Survey (DCWS) by conducting live, in-depth interviews of 1,108 randomly-selected Connecticut adults from late July to mid-August 2020. Unlike larger-scale waves of the DCWS, this “rapid response” wave of the DCWS had a shorter questionnaire and was focused on estimating statewide trends by community type and demographic group, but not on measuring conditions within specific neighborhoods or small towns. Due to the smaller sample size of the 2020 DCWS wave as compared to the large-scale 2015 and 2018 DCWS waves, results should be compared to past years with caution.
2020 Survey Results
- A press release and statewide crosstabs with estimates for each survey question by gender, race, income, and other factors are now available. Click here for an electronic version of just the press release.
- A media advisory with preliminary information was posted in early September, and results from the DCWS have been used in Governor Ned Lamont’s COVID-19 press briefing. A list of press coverage, including several front-page newspaper articles, may be found here.
2018 DataHaven Community Wellbeing Survey (Wave 3)
In 2018, over 16,000 randomly-selected adults in every town in Connecticut participated in live, in-depth interviews. Support for the survey was provided by more than 80 public and private partners throughout the state.
2018 Survey Results
- First published in 2021, the Town Equity Reports for all 169 towns in Connecticut include more detailed data from the survey, by town/area and race/ethnicity.
- Detailed 2019 reports published with our partners throughout Fairfield County, Greater Hartford, Greater New Haven, the Naugatuck Valley and other areas, as well as special topic reports such as one on health equity and social inequality in Connecticut, incorporate DataHaven survey results with many other national, state, and local data sources.
- Index of crosstabs for all geographic areas within Connecticut. Data for the individual towns and regions or groupings of towns other than those posted on this website may be available on request.
- Statewide crosstab of weighted estimates for Connecticut, by age, race, gender, and other factors
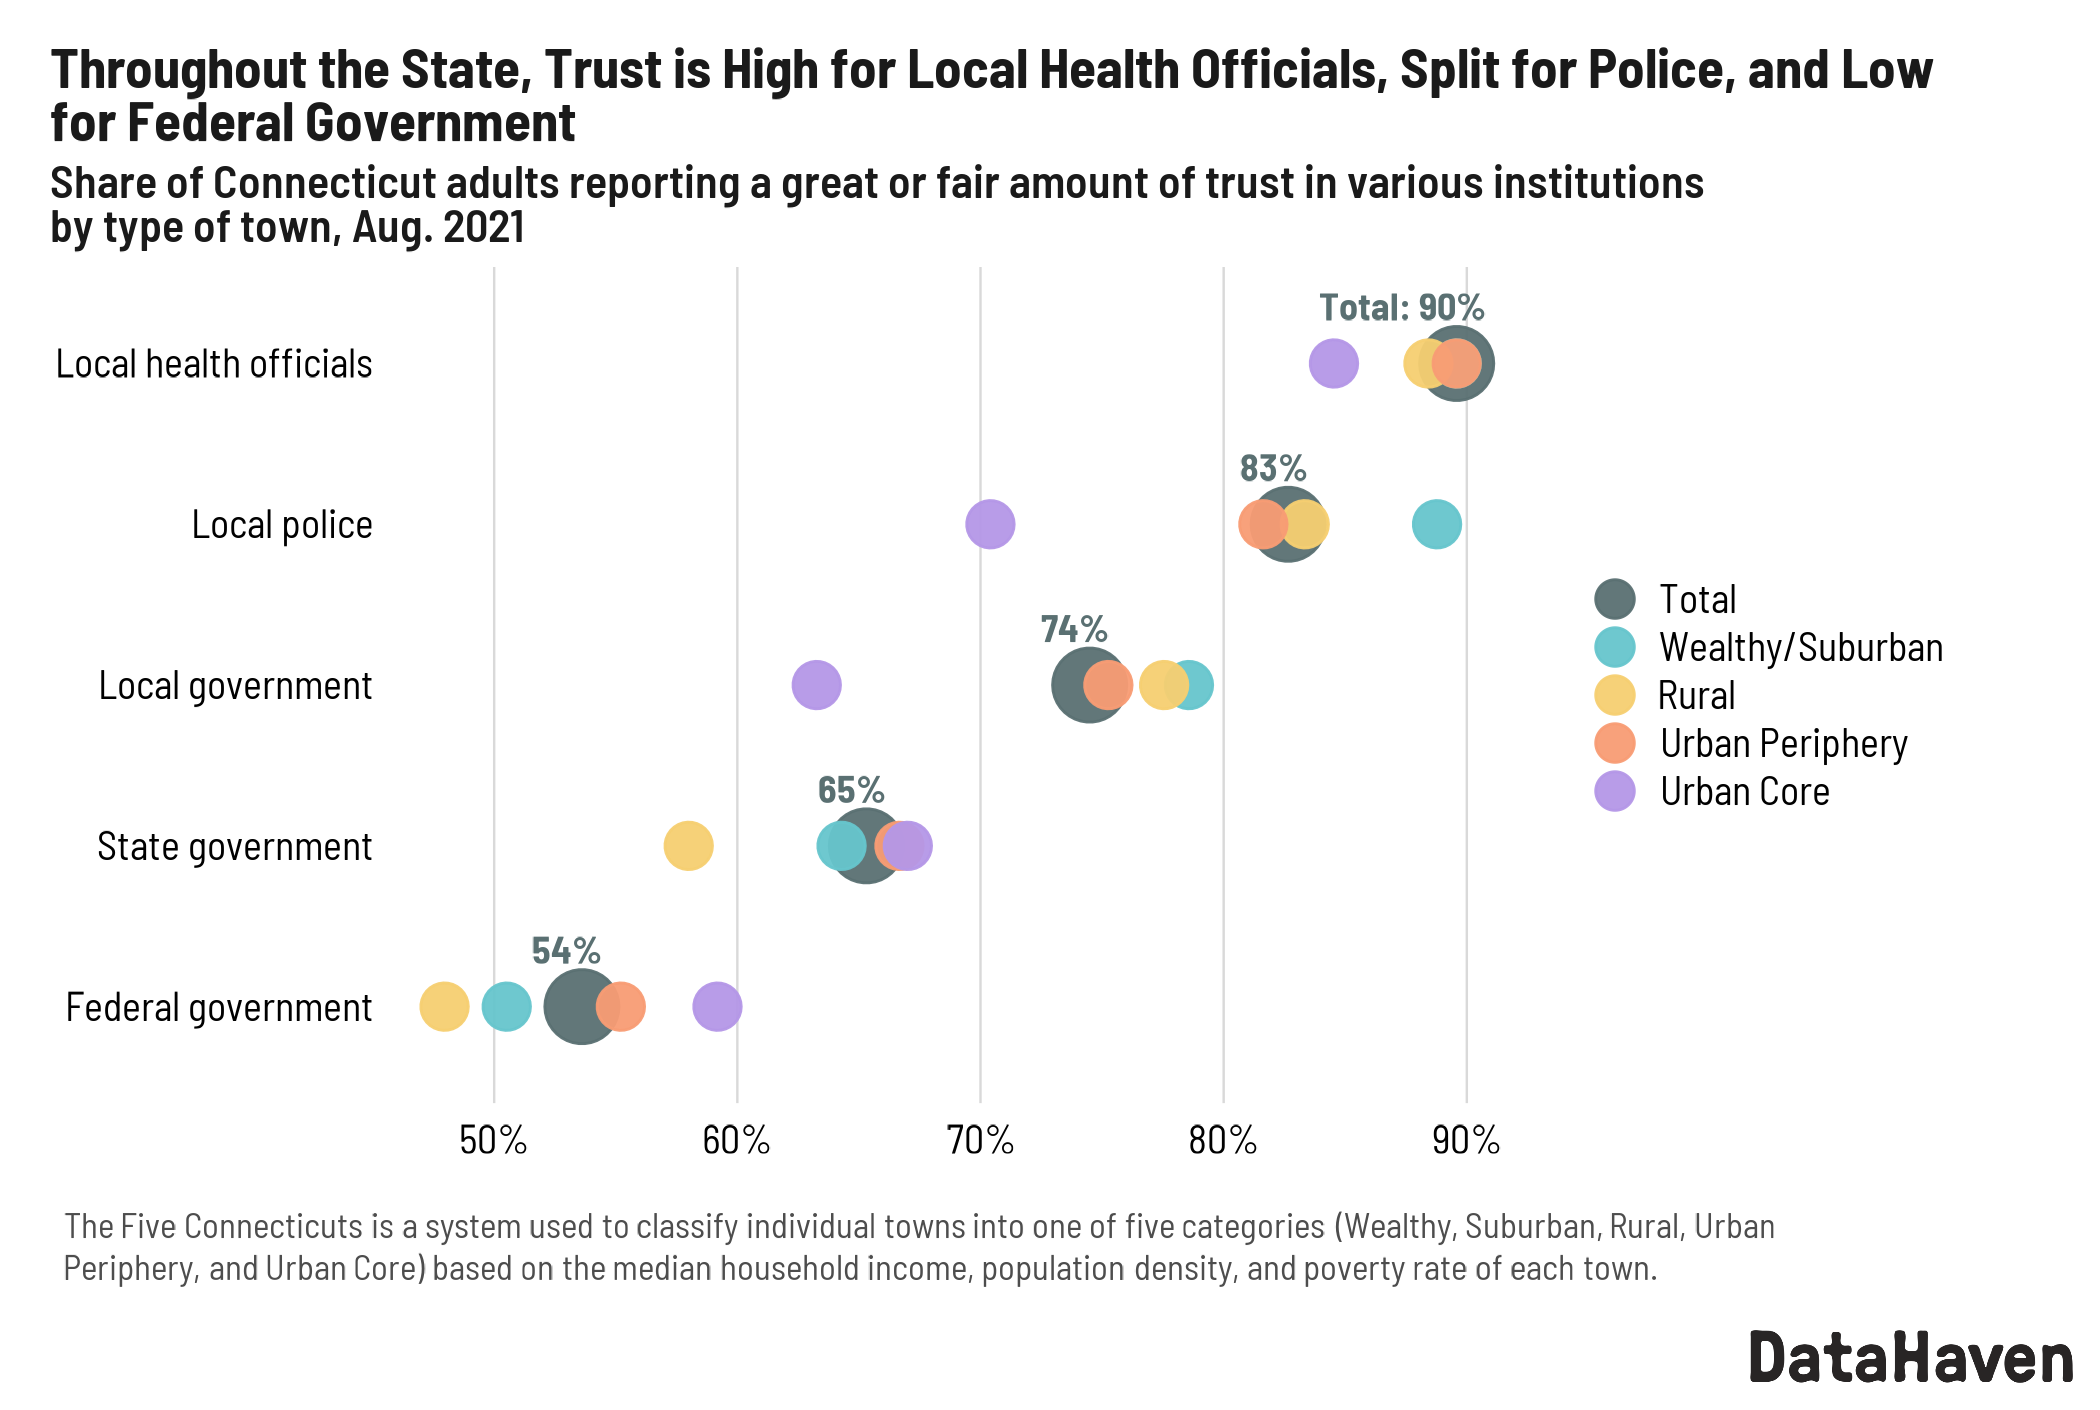
- Statewide crosstab of weighted estimates for the “Five Connecticuts” groupings of wealthy, suburban, rural, urban periphery, and urban core towns
- Press release announcing commencement of 2018 Community Wellbeing Survey and list of funders
- 25th Anniversary and Statewide Data Release Summary (PDF): 25th Anniversary and Statewide Data Release Summary

2015 DataHaven Community Wellbeing Survey (Wave 2)
In 2015, DataHaven expanded the Community Wellbeing Survey to encompass the entire State of Connecticut (as well as a small section of New York State), while retaining its mission to produce high-quality neighborhood-level and regional estimates for areas including Greater New Haven, Greater Bridgeport, Lower Fairfield County, Greater Hartford and New Britain, Southeastern Connecticut, the Naugatuck Valley, and other areas. The program completed in-depth interviews of nearly 17,000 randomly-selected residents in 2015.
2015 Survey Results
- Detailed 2016-2017 reports incorporating survey results and other data sources: Merging 500 Cities and Connecticut Data, Fairfield County Community Wellbeing Index, Greater New Haven Community Index, Connecticut Civic Health Index, Valley Community Index, Status of Women and Girls in Eastern Connecticut, and others
- Index of crosstabs for all geographic areas within Connecticut (NEW!)
- Statewide crosstab of weighted estimates for Connecticut, by age, race, gender, and other factors
- Statewide crosstab of weighted estimates for the “Five Connecticuts” groupings of wealthy, suburban, rural, urban periphery, and urban core towns
- Data for other geographical areas within Connecticut and New York State (posted within Data Resources section, more available upon request)
- Press release announcing completion of the 2015 DataHaven Community Wellbeing Survey
- Press release announcing commencement of 2015 Community Wellbeing Survey and list of partners
2012 DataHaven Community Wellbeing Survey (Wave 1)
The 2012 Community Wellbeing Survey asked 1,307 randomly selected adults living in New Haven and 12 surrounding towns what they thought about a variety of issues related to well-being, quality of life, and public health. Concurrently, an additional 1,300 residents in six New Haven neighborhoods were randomly selected and interviewed in person through a survey conducted by the Community Alliance for Research and Engagement.
2012 Survey Results
- Press release and executive summary of 2012 Community Wellbeing Survey results
- Greater New Haven Community Index 2013 – Detailed report based on Survey results and other data sources
- Crosstab of 2012 survey results
DataHaven Community Wellbeing Survey Research Advisory Committee and Advisory Council
The survey is developed with input from a Research Advisory Committee as well as an Advisory Council. The survey uses validated questions from national and international surveys to allow comparisons to benchmark data.
From 2018 through 2024, the Research Advisory Committee has included experts in survey research and epidemiology such as Sue Starkey, Northeast District Department of Health; Don Levy, Siena College Research Institute; Amanda Durante, Connecticut Department of Public Health; Brita Roy, Yale University; Byron Kennedy, New Haven Health Department; Mark Abraham, DataHaven; Jennifer Calder, Stamford Health Department; Lisa Morrissey, Danbury Health Department and Bridgeport Health Department; Russell Melmed, Ledge Light Health District and Chatham Health District; Amy Carroll-Scott, Drexel University; Tung Nguyen, City of Hartford; Brian Weeks, New Haven Health Department; Shayna Cunningham, University of Connecticut; Kathleen Duffany, Yale University; Emily Wang, Yale University; Victor G Villagra, University of Connecticut; Gregg Gonsalves, Yale University; Danya Keene, Yale University; Jane Ungemack, University of Connecticut.
Advisory Council members include representatives from approximately 300 different public agencies and private organizations throughout the state, representing a wide range of interests. Anyone may join the Advisory Council. Please sign up for our e-newsletter (at the bottom of this page) to receive invitations to the next round of Council meetings.
DataHaven Community Wellbeing Survey Funders
Please see our list of sponsors and partners. Please contact us to learn more.
PDF of report. See main report page for more information.
This brief report, published by DataHaven and The Connecticut Immigrant Support Network, summarizes the impact of immigrants on Connecticut’s economy.
Immigrants play a critical role in supporting the Connecticut economy by filling crucial labor gaps, creating new businesses, contributing to state and local tax revenues, and supporting the state’s economy. For example, immigrants make up 15% of the state’s population but hold about 20% of all jobs. Immigrant workers are critical to sectors like construction, agriculture, health care, and early childhood education, and also account for 26% of the state’s entrepreneurs. It also notes that immigrant-led households in Connecticut wield approximately $22 billion in spending power, which supports businesses and jobs across the state.