
Upcoming public events are shown below. We also post information related to upcoming events on our social media pages. Many DataHaven events are co-hosted with our partner organizations, so are open by invitation only and/or are announced through our partners’ email lists. To learn more or request that we lead a workshop for your organization, please visit our Programs and Events page or contact us directly.
Data Office Hours: March to April 2026
DataHaven is excited to announce Data Office Hours, coming to a cafe near you in Hartford, Middletown, New Haven, New London, and Norwalk, as well as virtually!
– Do you have a question about the best ways to find or use data on behalf of your organization?
– A project you are looking to talk about with data-loving colleagues?
– Interested in brainstorming or troubleshooting with a data expert? Not sure where to start?
Data Office Hours are open to data enthusiasts of ALL levels of skill and experience and are designed to provide a casual and comfortable space to chat with DataHaven staff over a warm beverage or tasty treat. Come 30 minutes early (where noted in the schedule) to join for a mini data visualization workshop, and stay to connect with DataHaven staff about your data questions. Whether you are looking for technical assistance, a thought partner, or a safe space to get started, Data Office Hours are for you!
An RSVP is appreciated, but not required (except for the virtual session). Please email info@ctdatahaven.org to RSVP.
Schedule
New Haven: Wednesday, March 4, 2026
Location: Book Trader Cafe
Mini Data Visualization Workshop: 11:00am-11:30am
Office Hours: 11:30am-1:00pm
Norwalk: Tuesday, March 10, 2026
Location: Carpe Diem Cafe
Office Hours: 12:00-1:30pm
Virtual: Wednesday, March 11, 2026
Location: Zoom
Please RSVP to info@ctdatahaven.org. Attendees will receive an email with the Zoom link.
Mini Data Visualization Workshop: 4:30-5:00pm
Office Hours: 5:00-6:30pm
New London: Thursday, March 19, 2026
Location: Washington Street Coffee House
Office Hours: 12:30-2:00pm
Hartford: Thursday, March 26, 2026
Location: Story and Soil Coffee
Office Hours: 10:00-11:30am
Middletown: Wednesday, April 1, 2026
Location: Klekolo World Coffee
Office Hours: 2:00-3:30pm
This group activity is designed to accompany a review of a relevant data source (such as the Connecticut Town Equity Reports), perhaps as part of one of our Connecticut Data Workshops or trainings.
Step 1: Group Brainstorming: How will leveraging data support my / my organization’s work? (15 min)
- Fundraising
- Advocacy
- Reporting
- Telling your organization’s story
- Wildcard: How else could you employ these data to further your mission?
Step 2: Practice! (2-4 minutes per person)
- Fundraising → Make the pitch to your table!
- Advocacy → Practice communicating your goal to your table as you would a legislator!
- Reporting → Practice describing a report you might create, and how it sparks action
- Storytelling → How can data help illustrate your organization? Your stakeholders’ lived experiences? The landscape in which you work?
Step 3: Group Reflection (15 min)
- How did it go?
- Once you brainstormed, did the practice flow easily, or was it a bit clunky/uncomfortable?
- What tools, information, or additional support would help ease/improve the experience?
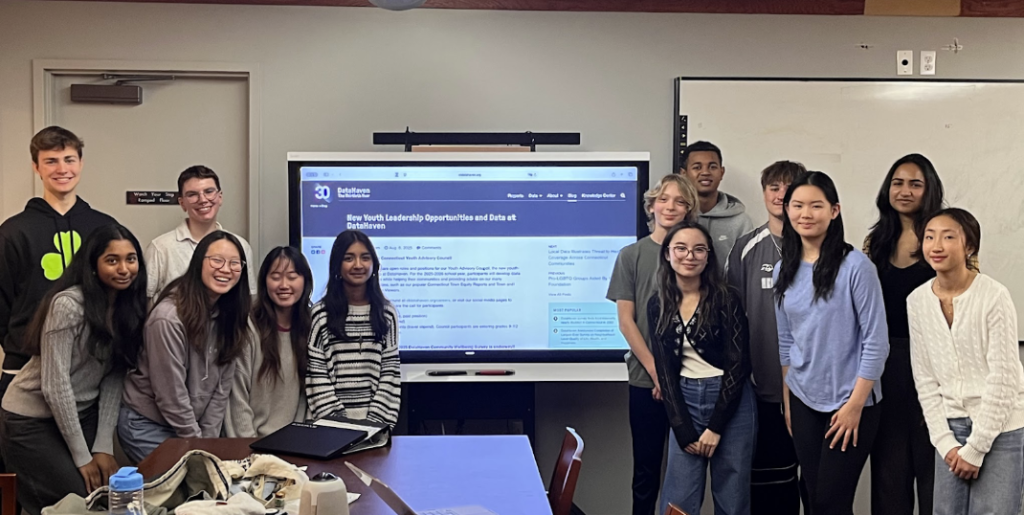
DHYAC cultivates youth leaders who use data to listen, question, and advocate for stronger, more equitable communities across Connecticut.
What We Do
Youth Data & AI Literacy
- Weekly sessions in public libraries and community spaces
- Learn to interpret civic data, use AI tools responsibly, and question systems
Participatory Action Research
- High school students design and run their own research projects
- Topics include education equity, housing, digital access, environmental health, and mental health
Community Storytelling & Advocacy
- Turn complex data into presentations, visualizations, social media content, and testimony
- Share findings with peers, families, educators, policymakers, and local organizations
Career Pathways & Mentorship
- Panels with data scientists, public officials, healthcare and education practitioners
- Youth see how data and AI connect to real jobs and community impact
Youth Voice in Statewide Data Systems
- Advising DataHaven’s statewide surveys
- Representing youth voice in statewide conversations about well-being
How to Get Involved
For Youth:
- Apply to join a future DHYAC cohort
- Attend a community showcase
- Request a workshop at your school or library
For Partners / Funders:
- Invite DHYAC youth to present at your event
- Collaborate on youth-focused data or AI projects
- Support youth stipends and showcase events
Contact us
Please visit the main Contact page on this website to be in touch.
Meet the Council
2025-2026 Council member photos and bios to be posted here.
- Brandon Gentles
- Charles Sudmyer
- Connor Bradford
- Drew Thomas
- Ethan Liu
- Gopika Kaimal
- Hendry Lombert
- Ishaan Bherwani
- Janet Fan
- Linda Chen
- Lulu Hu
- Natalie Joo
- Noah Sanderson
- Rania Das
- Rebecca Spiewak
- Saanika Tipnis
- Tanisha Sahu
- Tina Zeng
The DataHaven website was redesigned by Studio Kudos in November 2025. Stay tuned to our social media pages for more information on how to navigate the new site!
Previous versions of the DataHaven website included:
- A Drupal version designed by Studio Kudos, which was live from 2015 to 2025, on which this site is largely based.
- A WordPress version, live from 2009 to 2015.
- The original version of DataHaven, live from 2003 to 2009, which featured a community indicators lookup tool.
DataHaven prides itself in empowering people to create thriving communities by collecting and ensuring access to data on well-being, equity, and quality of life. The classroom is a fundamental and formative space where understanding of social justice, human rights, equity, and community well-being is fostered. Educators serve a pivotal role in empowering and informing youth, encouraging their voices and giving them the proper tools to enact change in their communities.
From time to time, DataHaven has released a series of classroom materials designed by educators for educators. Through classroom experiences and the learning process, students can understand and change their world in ways that benefit themselves and their communities.
Contents
In addition to these easy-to-use materials, we encourage you to use the other reports and data on the DataHaven website in your classroom activities. DataHaven resources are widely used by teachers in K-12 schools, colleges, and graduate program across Connecticut. Please contact us for suggestions!
DataHaven 2023 Classroom Materials
Authored By: Sarah Wiederecht, with support from Dylan Bober, Victor Cazabal, and Emilie Waters. Sarah Wiederecht is a social studies teacher in Manchester, Connecticut.
The 2023 Classroom Materials and Resources have eight overarching themes (community wellness, democracy, education, gender equality, health, immigration, intersectionality, and race). They are organized into packets to make them easier to distribute and use. Each packet is approximately 10-15 pages, and may contain readings for different grade levels (described as Levels I, II, and/or III), as well as suggested classroom exercises and activities. Materials in the packets are drawn from DataHaven’s 2023 Community Wellbeing Index and other reports.
We encourage your feedback and suggestions. Please see below for more information.
DataHaven 2020 Classroom Materials
Authored By: Sarah Wiederecht, Chloe Shawah, and John Park. Sarah Wiederecht is a social studies teacher in Manchester, Connecticut.
These materials utilize DataHaven’s work, especially the Community Index publications, and focus on four overarching themes:
Gender
| Document | Description |
|---|---|
| This can be used to gauge students’ initial understanding, create discussion, and introduce the topic of gender. | |
| This provides an idea of where students stand with their understanding of gender roles. It can be used to further explain what needs to be revisited. | |
| This can be used to gauge students’ initial understanding, create discussion, and introduce the topic of gender roles. | |
| By looking at Community Wellbeing Survey data, students practice how to read data and consider the real life implications of the data. | |
| This assignment asks students to define key words in an excerpt from Count Her In (2019) and fosters deeper understanding of gender based disparities in education. | |
| This provides background on the wage gap, specific to Connecticut. It can be followed up with the data collection assignment. | |
| These stations involve passages on the gender wage gap as well as data figures. | |
| To investigate the gender wage gap in their own communities, students practice real life data collection and interpretation. | |
| This is a reflection concluding the classwork series on the gender wage gap. |
Race
| Document | Description |
|---|---|
| This can be used to gauge students’ initial understanding, create discussion, and introduce the topic of race. | |
| This provides an idea of where students stand with their understanding of race. It can be used to further explain what needs to be revisited. | |
| This can be used to gauge students’ initial understanding, create discussion, and introduce the topic of racial stereotypes. | |
| Students read a passage introducing the history and effects of redlning and answer thought questions. | |
| The above assignment is broken into separate stations. | |
| Using what they learned about redlining, students propose and create a PSA (rubric included). | |
| Students read a background passage, and then are tasked with researching an example of environmental racism on their own. | |
| Students read and analyze data from the 2019 Community Wellbeing Index and answer thought questions. | |
| Students read a background passage on social mobility and answer thought questions. |
Health
| Document | Description |
|---|---|
| This can be used to gauge students’ initial understanding, create discussion, and introduce the topic of healthcare. | |
| This provides an idea of where students stand with their understanding of healthcare. It can be used to further explain what needs to be revisited. | |
| Students read a background passage on the opioid epidemic, draw a graph based on the data in the reading, and answer thought questions. | |
| This is a longer version of the above assignemnt. It includes specific data points from the Community Wellbeing Index reports. | |
| The opioid crisis assignment is broken into separate stations. | |
| Using what they learned about the opioid crisis, students propose and create a PSA (rubric included). | |
| Students read a passage and answer thought questions about asthma, a persistent component of health inequality in Connecticut. | |
| Students read a passage about healthcare inequalities for LGBTQ+ individuals and draw a graph using the data they read. | |
| This includes excerpts from our Health Equity Report. | |
| “Think Pair Share” activities allow students to learn about a topic, interact with a peer to learn about their chosen topic, and then sharing their two chosen topics to the class. | |
| After defining key words, students read and reflect on an excerpt from our Health Equity Report. |
Civics
| Document | Description |
|---|---|
| This can be used to gauge students’ initial understanding, create discussion, and introduce the topic of voting. | |
| Students read a passage and graph on elections and election turnout. | |
| Students read four primary sources and a Pew Research Center article to understand the history and importance of voting. | |
| Students explore the US Census website to learn more about the importance of the Census. | |
| Students read about the five generations since 1925 in Part I. In Part II, a Pew Research Center articles dives deeper into generational divides. | |
| This includes an excerpt from Count Her In (2019). | |
| DataHaven’s Connecticut Wellbeing and Equity Data App contains visualizations of a wide variety of data. Students are guided through exploring this app. | |
| Through reading from the 2019 Greater Hartford Community Wellbeing Index and the Hartford Climate Action Plan, students learn about local, contemporary efforts to address climate change. | |
| Students learn about the history of immigration and the current state of New Haven’s population. | |
| Students research a cultural organization in New Haven of their own choosing. | |
| This includes an excerpt from the 2019 Community Wellbeing Index and corresponding thought questions. | |
| This assignment introduces students to the data collection and analysis process. They choose a topic of their own to research. | |
| First students read about three key components of civic life. Then, they are tasked with conducting research in their own community. |
Feedback and suggestions
Used one of the above resources? Questions, comments, concerns? Email us at info [at] ctdatahaven.org with a description of your teaching approach and needs. Many additional resources on the DataHaven website are commonly used in classroom settings and we encourage you to browse or contact us for assistance.
This was one of the most popular pages on an earlier (2003-2009) version of the DataHaven website.
A Guide to Grant Writing: The Needs Assessment
Have you witnessed a problem in your community, such as underage alcohol consumption, and want to change it but are not sure where to begin? The first step is to develop a needs assessment that clearly portrays the problem. This needs assessment may also be used in a grant application that will allow you to obtain the funds needed to address your observed need. These presented methods are intended to assist organizations in the incorporation of data into the grant proposal in order to develop a stronger, more competitive submission. The foundation of a successful grant proposal is a strong needs assessment that successfully compiles, analyzes, and presents information in order to convey the necessity and rationale for your proposed program plan. There are many good online sources of technical assistance for grant writing.
Below are some guidelines for writing a broad community-based project needs assessment are summarized.
The Data
The needs assessment should clearly and concisely demonstrate that a relevant problem or need exists. The first step of this process is to include relevant supporting data. Such data may pertain to demographics, economic health, education, crime and safety, environment, youth development, and health. When selecting data, it is important that the data is beneficial and not detrimental to your needs assessment.
In general, the data should clearly describe your target population and the need that is being addressed. Using the example of underage alcohol consumption, some supporting data might be: the age distribution of your community, % of population in high school, % of children that consume alcohol, the number of under age drinking citations the police department issued in the past year, the frequency children consume alcohol, the volume of alcohol consumed and the location of liquor stores.
Careful consideration must be taken when determining what data to include in the needs assessment. In general, only use data that is relevant and specific to your proposal. Most likely this will require you to come up with specific data. Regardless of the indicators and variables used, they should adhere to five guidelines:
- State the need using hard data, not assumptions or undocumented assertions.
- Only use statistics that are clear and supporting of your argument
- Use comparative statistics and research when possible.
- Make sure all data collection is well documented.
- Don’t overuse statistics.
The Data Center in New Orleans developed a list of tips on the kinds of data funders find helpful and the kinds of data they find not helpful, which we’ve modified slightly for this page. A quick way to critique the usefulness of the data you’ve been putting in your problem statements is to scan down the “not helpful” column and see if you’ve ever used data that’s not helpful. (A lot of people do, so don’t be embarrassed.) If you see a type of data that you’ve used that’s not helpful, you’ll see next to it a helpful alternative. Reviewing this list should put you on the path to giving funders the data they really want in problem statements.
|
NOT Helpful |
Helpful |
|
|
Data that represents geographic areas larger than the area you are targeting (like cancer rates for the whole state of Connecticut when you are only going to be doing cancer screenings in the housing developments in one town). |
vs |
Data that represents the specific neighborhood(s) where you are working (such as data from DataHaven’s neighborhood profiles).
|
|
Raw numbers that describe the problem in your area. |
vs |
Raw numbers AND percentages that show the proportion of the total population in your area that is affected by the problem. |
|
Only numbers that represent the geographic area where you work without any comparison data. |
vs |
Comparison data at a state, national town level and other geographic levels of interest to the funder. |
|
Data that is not relevant to the problem (like infant mortality rates when you are going to be providing asthma services). |
vs |
Data that scientific research has demonstrated is related to the problem you are addressing (like data about pregnancy-related deaths when you are going to be providing prenatal care). |
|
Data from newspapers, magazines, and TV news programs – sources that are not in the business of distributing reliable data. (Newspapers, for example, are in the business of selling newspapers, of course.) |
vs |
Data from reputable sources such as government agencies, national associations, and peer-reviewed journals. |
|
Data that are old (like 1990 Census data on race). |
vs |
Recent available data from the chosen data source (like 2020 Census data on race). |
|
All the data you’ve ever found that relates somewhat to the problem. We call this a “data dump.” |
vs |
Data carefully selected and narrowed down from the entire list of all the data you found and presented in a targeted, compelling, concise problem statement. |
If you follow the above tips, you will include data in your problem statement that funders will find very helpful. Remember that these tips apply only to needs assessments. Other parts of the grant proposal may require different types of data.
The Presentation
Your data is only useful if the reviewer can understand its presentation. The needs assessment should be a narrative of your data that conveys the urgency of your program. Besides embedding the data in the text, authors should also try to incorporate tables, charts, graphs, and maps. These effective presentation tools visually display comparisons and trends.
When presenting data in the form of tables, charts and graphs, be sure to adhere to the following rules:
- Always include an accompanying narrative in the text that describes what the data is and what the data is telling the reader.
- Clearly label all axes (for graphs and charts) and columns and rows (for tables).
- Include a title and reference.
- Consider numbering tables/figures for easier reference.
Things to Think About When Doing a Great Needs Assessment
- Am I clearly addressing an evident knowledge or need gap?
- What sets my project apart from the rest?
- Don’t assume the problem and solution are obvious to the reader. The reader is not necessarily an expert in the field.
- Is my data relevant, concise, and presented in an aesthetically pleasing manner?
- Did I follow the funder’s instructions and format properly?
- Did I avoid jargon, acronyms, and excess wording?
- Are my references and data well documented?
Looking Forward
A great needs assessment is the foundation to a successful grant application. In order make this transition, the needs assessment is extended and used to determine goals and methods on how to reduce the apparent need gap. These goals pertain to both the ultimate outcome of the project, as well as the minor objectives. Let’s use our program plan to decrease under age drinking. The ultimate measurable outcome would be the number of persons less than 21 years old that drink alcohol. A measurable minor objective would be the number of educational pamphlets outlining the negative effects of alcohol that are distributed to high school children. Using measurable outcomes will show the funder how many people or communities your program will impact.
This page facilitates access to data crosstabs from the DataHaven Community Wellbeing Survey (DCWS). This large survey program has completed over 50,000 live, in-depth interviews with randomly-selected adults in every Connecticut town in 2015, 2018, 2020, 2021, 2022, 2024, and 2025, so results are available for all area regions, towns, and neighborhoods.
As described in the crosstab methodology page, to ensure representativeness, all survey estimates that we create are weighted by age, race, gender, and geography in proportion to U.S. Census Bureau data from each region or town.
Below, you may browse an list of regions and individual towns/cities for which we have created a printed crosstab. Data are available for many other towns and regions as well. You will find a summary of survey data for many towns in our Town Equity Reports, available for all 169 towns in Connecticut, and in some of the interactive tools on our Data Dashboard.
Please contact us with questions regarding data access; much more granular estimates for specific areas or specific demographic groups are often available on request.
Selected Large Regions
*See links on the main survey page for all data. Data are also frequently provided on request, so please contact us for assistance.
| Area | 2015 | 2018 | 2020, 2021, 2022, 2024, 2025 |
|---|---|---|---|
| Statewide – Connecticut | Link | Link | 2020, 2021, 2022, 2024, 2025 |
| Five Connecticuts (CT town groupings) | Link | Link | All items here (as well as crosstabs for many other regions and groupings of towns) are available on request. |
| Greater New Haven (13 towns) | Link | Link | |
| Fairfield County | Link | Link | |
| Greater Hartford (CRCOG area) | Link | Link | |
| Lower Naugatuck Valley (7 towns) | Link | Link | |
| Greater Waterbury-CCF Region (towns) | posted on request | Link | |
| Greater New London (10 towns) | Link | Link | |
| Middlesex County | Link | Link | |
| Litchfield County | posted on request | posted on request | |
| Northeast District Department of Health area (12 towns including Putnam, Killingly, Brooklyn) | Link | Link |
Selected Large Towns / Cities
| Town | 2015 | 2018 | 2020, 2021, 2022, 2024, 2025 |
| Bridgeport | Link | Link | All items here are available on request. |
| New Haven | Link | Link | |
| Hartford | Link | Link | |
| Stamford | Link | Link | |
| Waterbury | Link | Link | |
| Norwalk | Link | Link | |
| Danbury | Link | Link | |
| New Britain | Link | Link | |
| Greenwich | Link | Link | |
| Bristol | Link | Link | |
| West Hartford | Link | Link | |
| Meriden | Link | Link | |
| Hamden | Link | Link | |
| Manchester | Link | posted on request | |
| Milford | Link | Link | |
| West Haven | Link | Link | |
| Stratford | Link | Link | |
| Middletown | Link | Link | |
| Groton | Link | posted on request | |
| Shelton | Link | posted on request | |
| New London | Link | Link | |
| Norwich | Link | posted on request | |
| Naugatuck | Link | posted on request | |
| New Milford | Link | Link |
Excerpt from an overview created by Wellville:
North Hartford, CT’s designation as a federal Promise Zone (NHPZ) in 2015 mobilized a renewed spirit of collaboration among city leaders, local organizations and citizens on behalf of North Hartford’s 24,000 residents. The North Hartford Triple Aim Collaborative (NHTAC) was launched in 2017 as the Health and Wellbeing work group for the NHPZ. Building on the significant work to date, the Collaborative is currently expanding its reach and impact by harnessing the increasing convergence of partners and resources committed to creating a healthier, more vibrant community for all.
The Collaborative serves as the Health and Wellbeing workgroup for the North Hartford Promise Zone (NHPZ), and also aligns with other local efforts to advance health and wellbeing throughout the city. In addition, the Collaborative is the designated lead for national initiatives such as Trinity Health’s Transforming Communities Initiative, Invest Health, and Wellville.
With the City of Hartford Health and Human Services as the lead, the Collaborative was recently selected as a “reference community” for the Health Enhancement Community (HEC) Initiative, which is part of Connecticut’s State Innovation Model (SIM) aimed at health care delivery and financing reforms. The Collaborative will participate in the development of new community-centered models that encourage multi-stakeholder partnerships across the state to work together to prevent disease, improve health, and lower costs. These new models will create paths to financial sustainability, potentially through “shared savings” from health insurers and other payers that reward specific outcomes.
Current Examples of Capacity Building
In addition to these and other actions to improve community health and wellbeing, the Collaborative is also co-investing in backbone support and other functional areas needed for success. For example:
Shared Data and Measurement: In partnership with DataHaven, Hartford Foundation for Public Giving and others, the Collaborative is developing a data and measurement system to establish shared goals and to track the ongoing impact of Collaborative actions through metrics that matter to community members and other stakeholders. DataHaven received grants in 2015 and 2018 from the Hartford Foundation for Public Giving, Saint Francis, Connecticut Health Foundation, Hartford HealthCare, and others to field the statewide DataHaven Community Wellbeing Survey (in 2015 and 2018). Current work is being done to produce a comprehensive regional community health and wellbeing index and indicators report tentatively titled the Greater Hartford Community Wellbeing Index. Planned to include significant stakeholder input, the cross-sector, collaborative report is designed to help meet the needs of multiple organizations through a coordinated local source. Still in development, the vision is that this shared work will serve simultaneously as the “data and measurement core” for area hospital Community Health Needs Assessments (CHNAs) and Community Health Improvement Plans (CHIPs) for health departments and hospitals, and a measurement system for health the NHTAC.
In addition to providing direct assistance to hundreds of non-profit organizations and agencies each year, DataHaven staff have worked with area schools, universities, employers, non-profit associations, philanthropic funders, and government agencies to provide training on the use of data in Connecticut for over 30 years.
Topics often covered in our Connecticut Data Workshops include:
- The importance of neighborhood-level and community-level data
- Accessing neighborhood-level, town-level, and community-level information through DataHaven
- Key trends in your community: Results from the statewide DataHaven Community Wellbeing Survey
- Visualizing data
- Designing surveys and focus groups
- Gathering and using data from federal agencies such as the U.S. Census Bureau, and from Connecticut state agencies, such as the Department of Public Health, Connecticut Department of Labor, and State Department of Education
- Using data to write grants
Please visit our technical assistance page for more information about our technical assistance services, or to contact DataHaven regarding the Connecticut Data Workshop program. An example of an agenda may be found below.
9:00-9:15AM: Welcome!
— DataHaven Staff Introductions
— Table Introductions
— Agenda for today’s session
9:15-9:45AM: Presentation and Q&A: DataHaven Website, 2025 DataHaven Community Wellbeing Results
— Presentation & New DataHaven Website Features
— Q&A
9:45-9:55AM: Data to Action: DataHaven Partners
— Presentation
9:55-10:55AM: Interactive Activity
(15 min) Brainstorming: How will leveraging data support my / my organization’s work?
(20 min) Practice!
(15 min) Reflection
(10 min) Share out
11:00AM: Adjourn